
Web Console
FastSim ships with a browser-based Web Console covering the full simulation lifecycle: Config editing, Real-time monitoring, and Recording analysis. The Web Console runs as a standalone process, fully decoupled from the simulation — you can use the config editor and recording viewer without a running simulation, and monitor state in real time while one is running.
Getting Started
# Start the Web Console
joysim_web

# Custom port
FASTSIM_WEB_PORT=3000 joysim_web
| Option | Default | Description |
|---|---|---|
FASTSIM_WEB_PORT | 8080 | Web Console listen port (env var) |
| Bind address | 0.0.0.0 | Allows external access |
Then open in your browser:
http://localhost:8080
Architecture
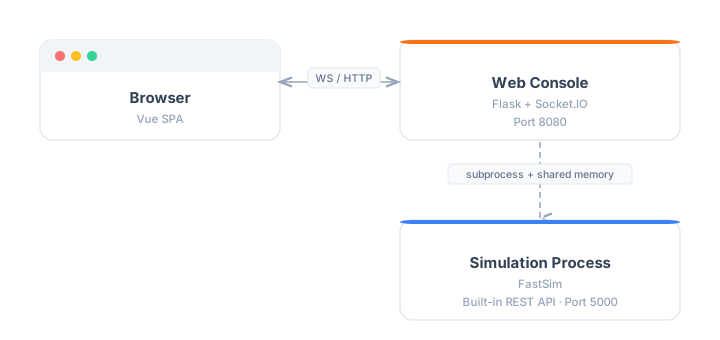
- Web Console is a Flask + Socket.IO server that manages simulations as subprocesses
- Real-time state is streamed via WebSocket (simulation prints
__JOYSIM_STATE__:JSON lines to stdout) - Camera frames use POSIX shared memory for zero-copy transfer (~0.1ms write latency)
- The simulation's built-in REST API (port 5000) is accessible through the Web Console proxy at
/api/sim-proxy/*
Modules
The Web Console has four pages accessible via the top navigation bar:
Config — Configuration Wizard
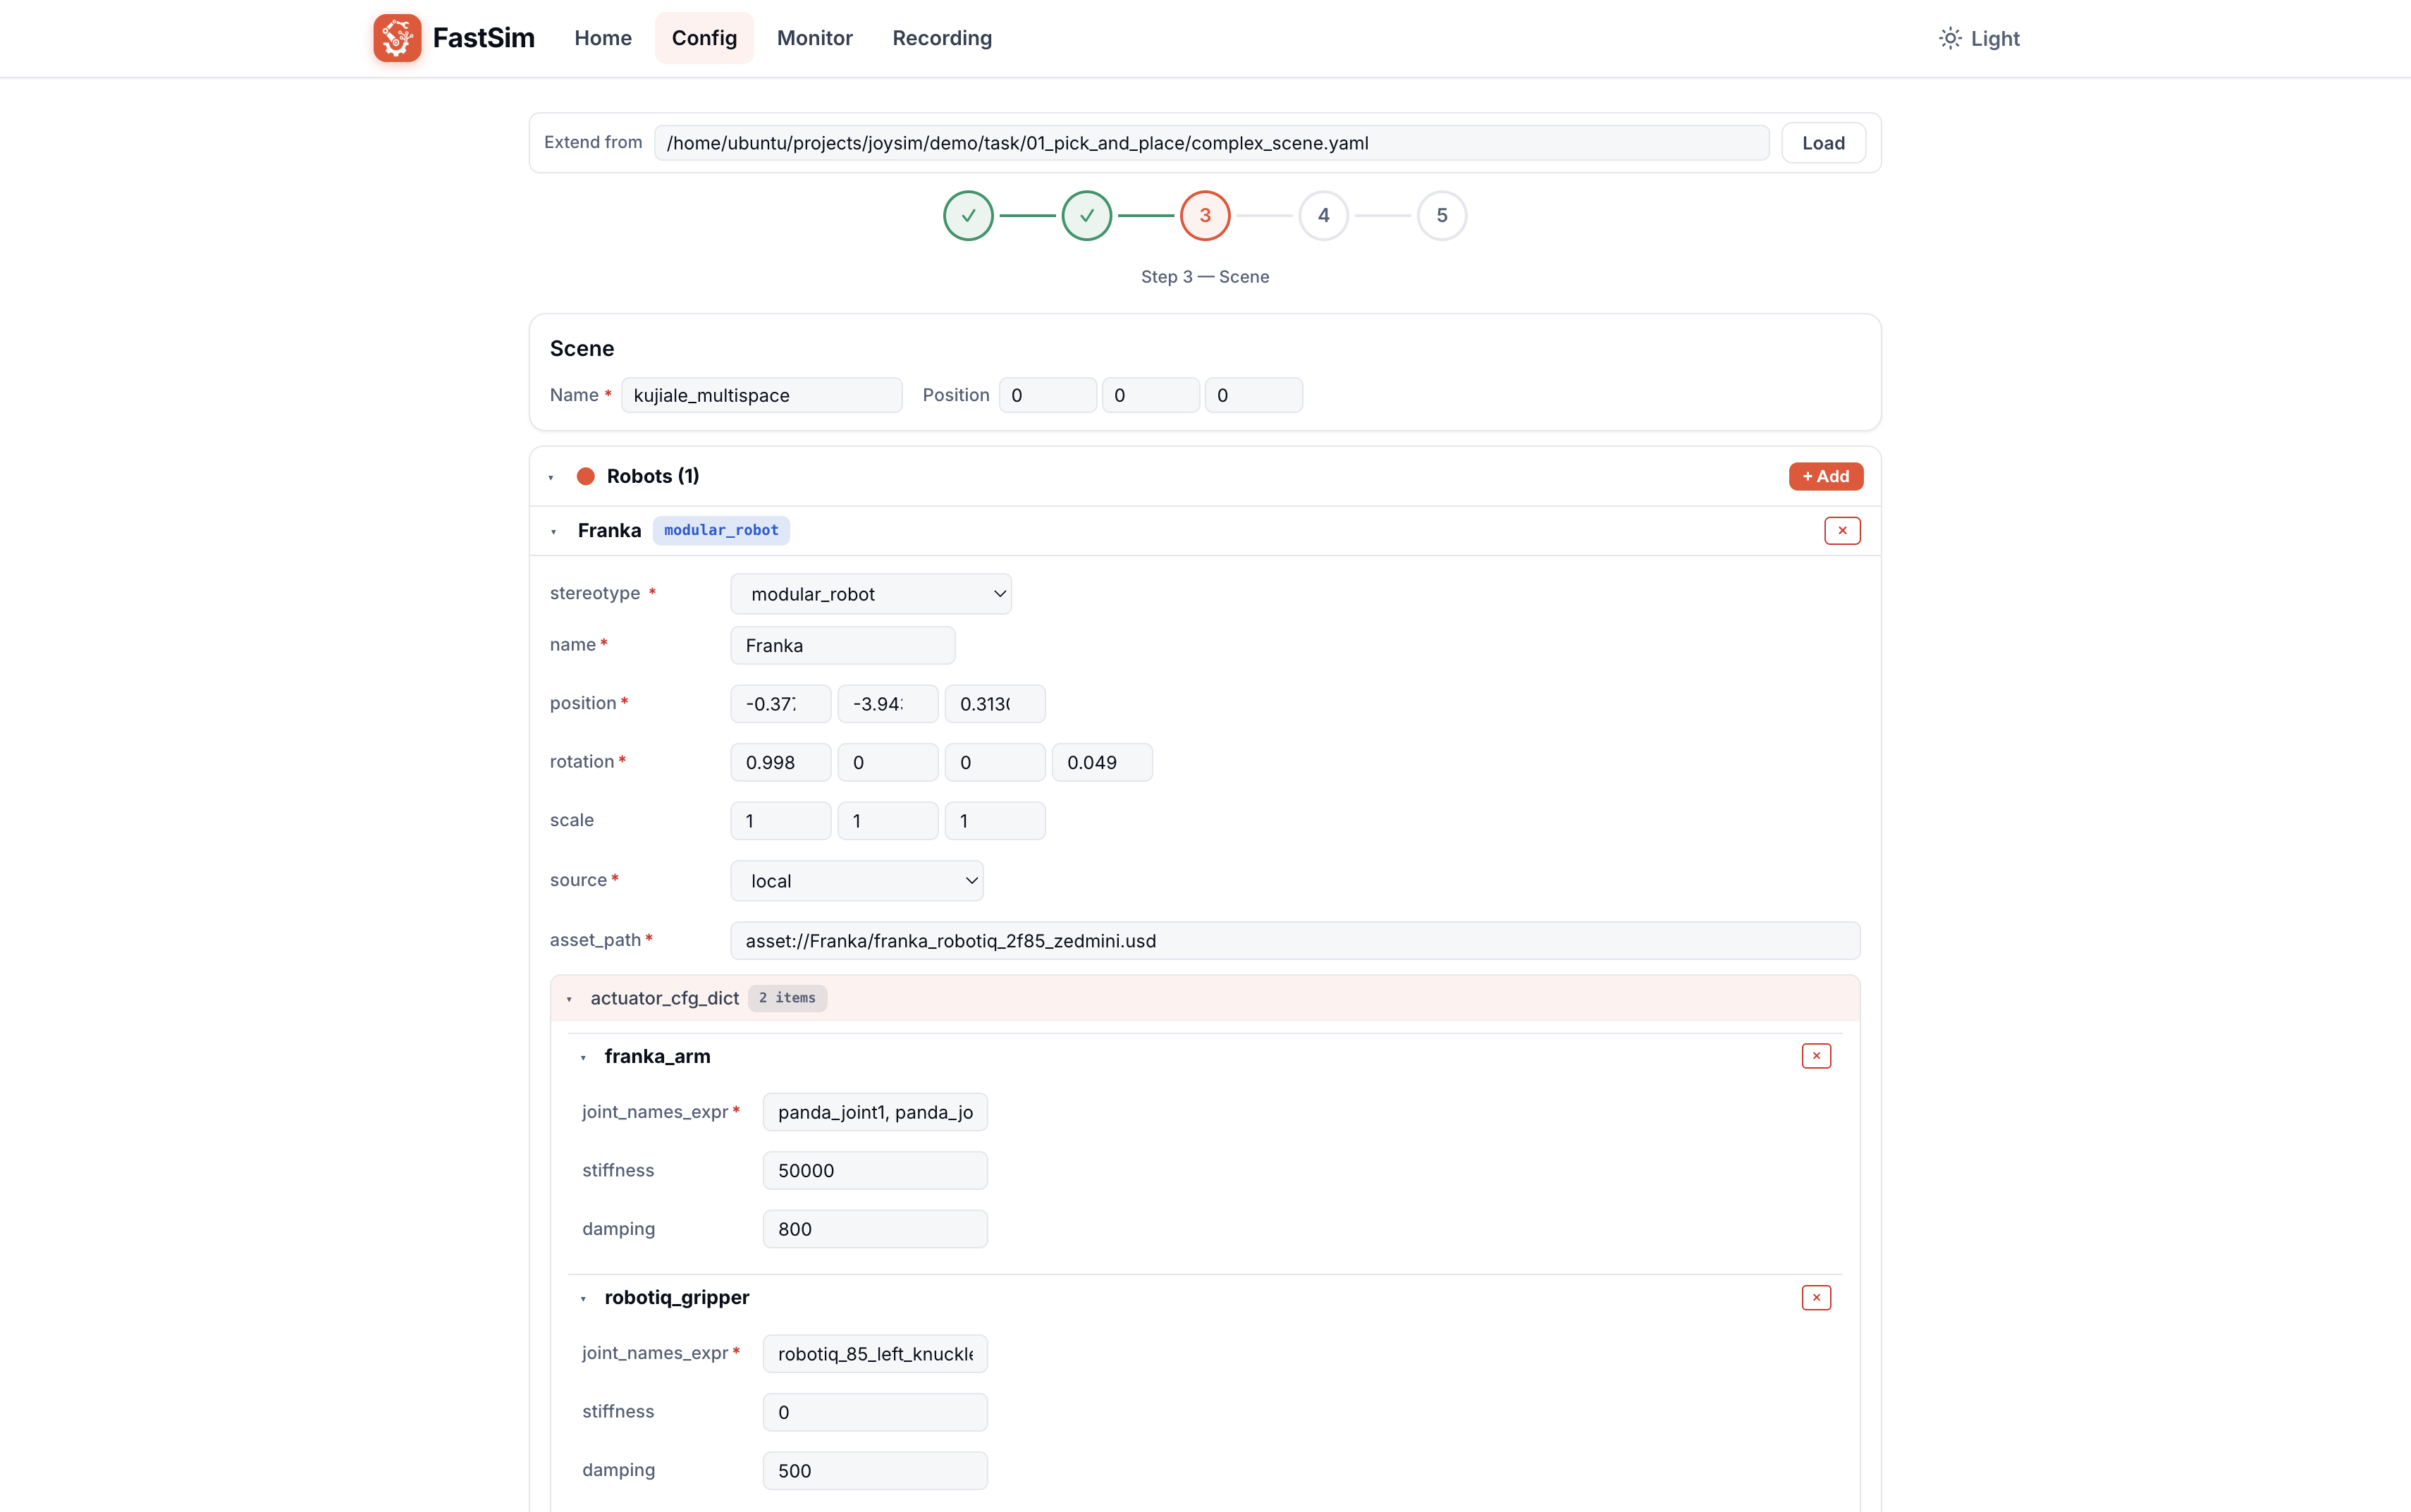
A visual configuration editor with a step-by-step wizard for creating or editing simulation configs.
 点击放大
点击放大 Five-Step Workflow
| Step | Content | Description |
|---|---|---|
| Step 1 | General | Project scanning, asset paths, logging |
| Step 2 | Simulation | Backend selection, physics, rendering |
| Step 3 | Scene | Robots, objects, sensors, lights |
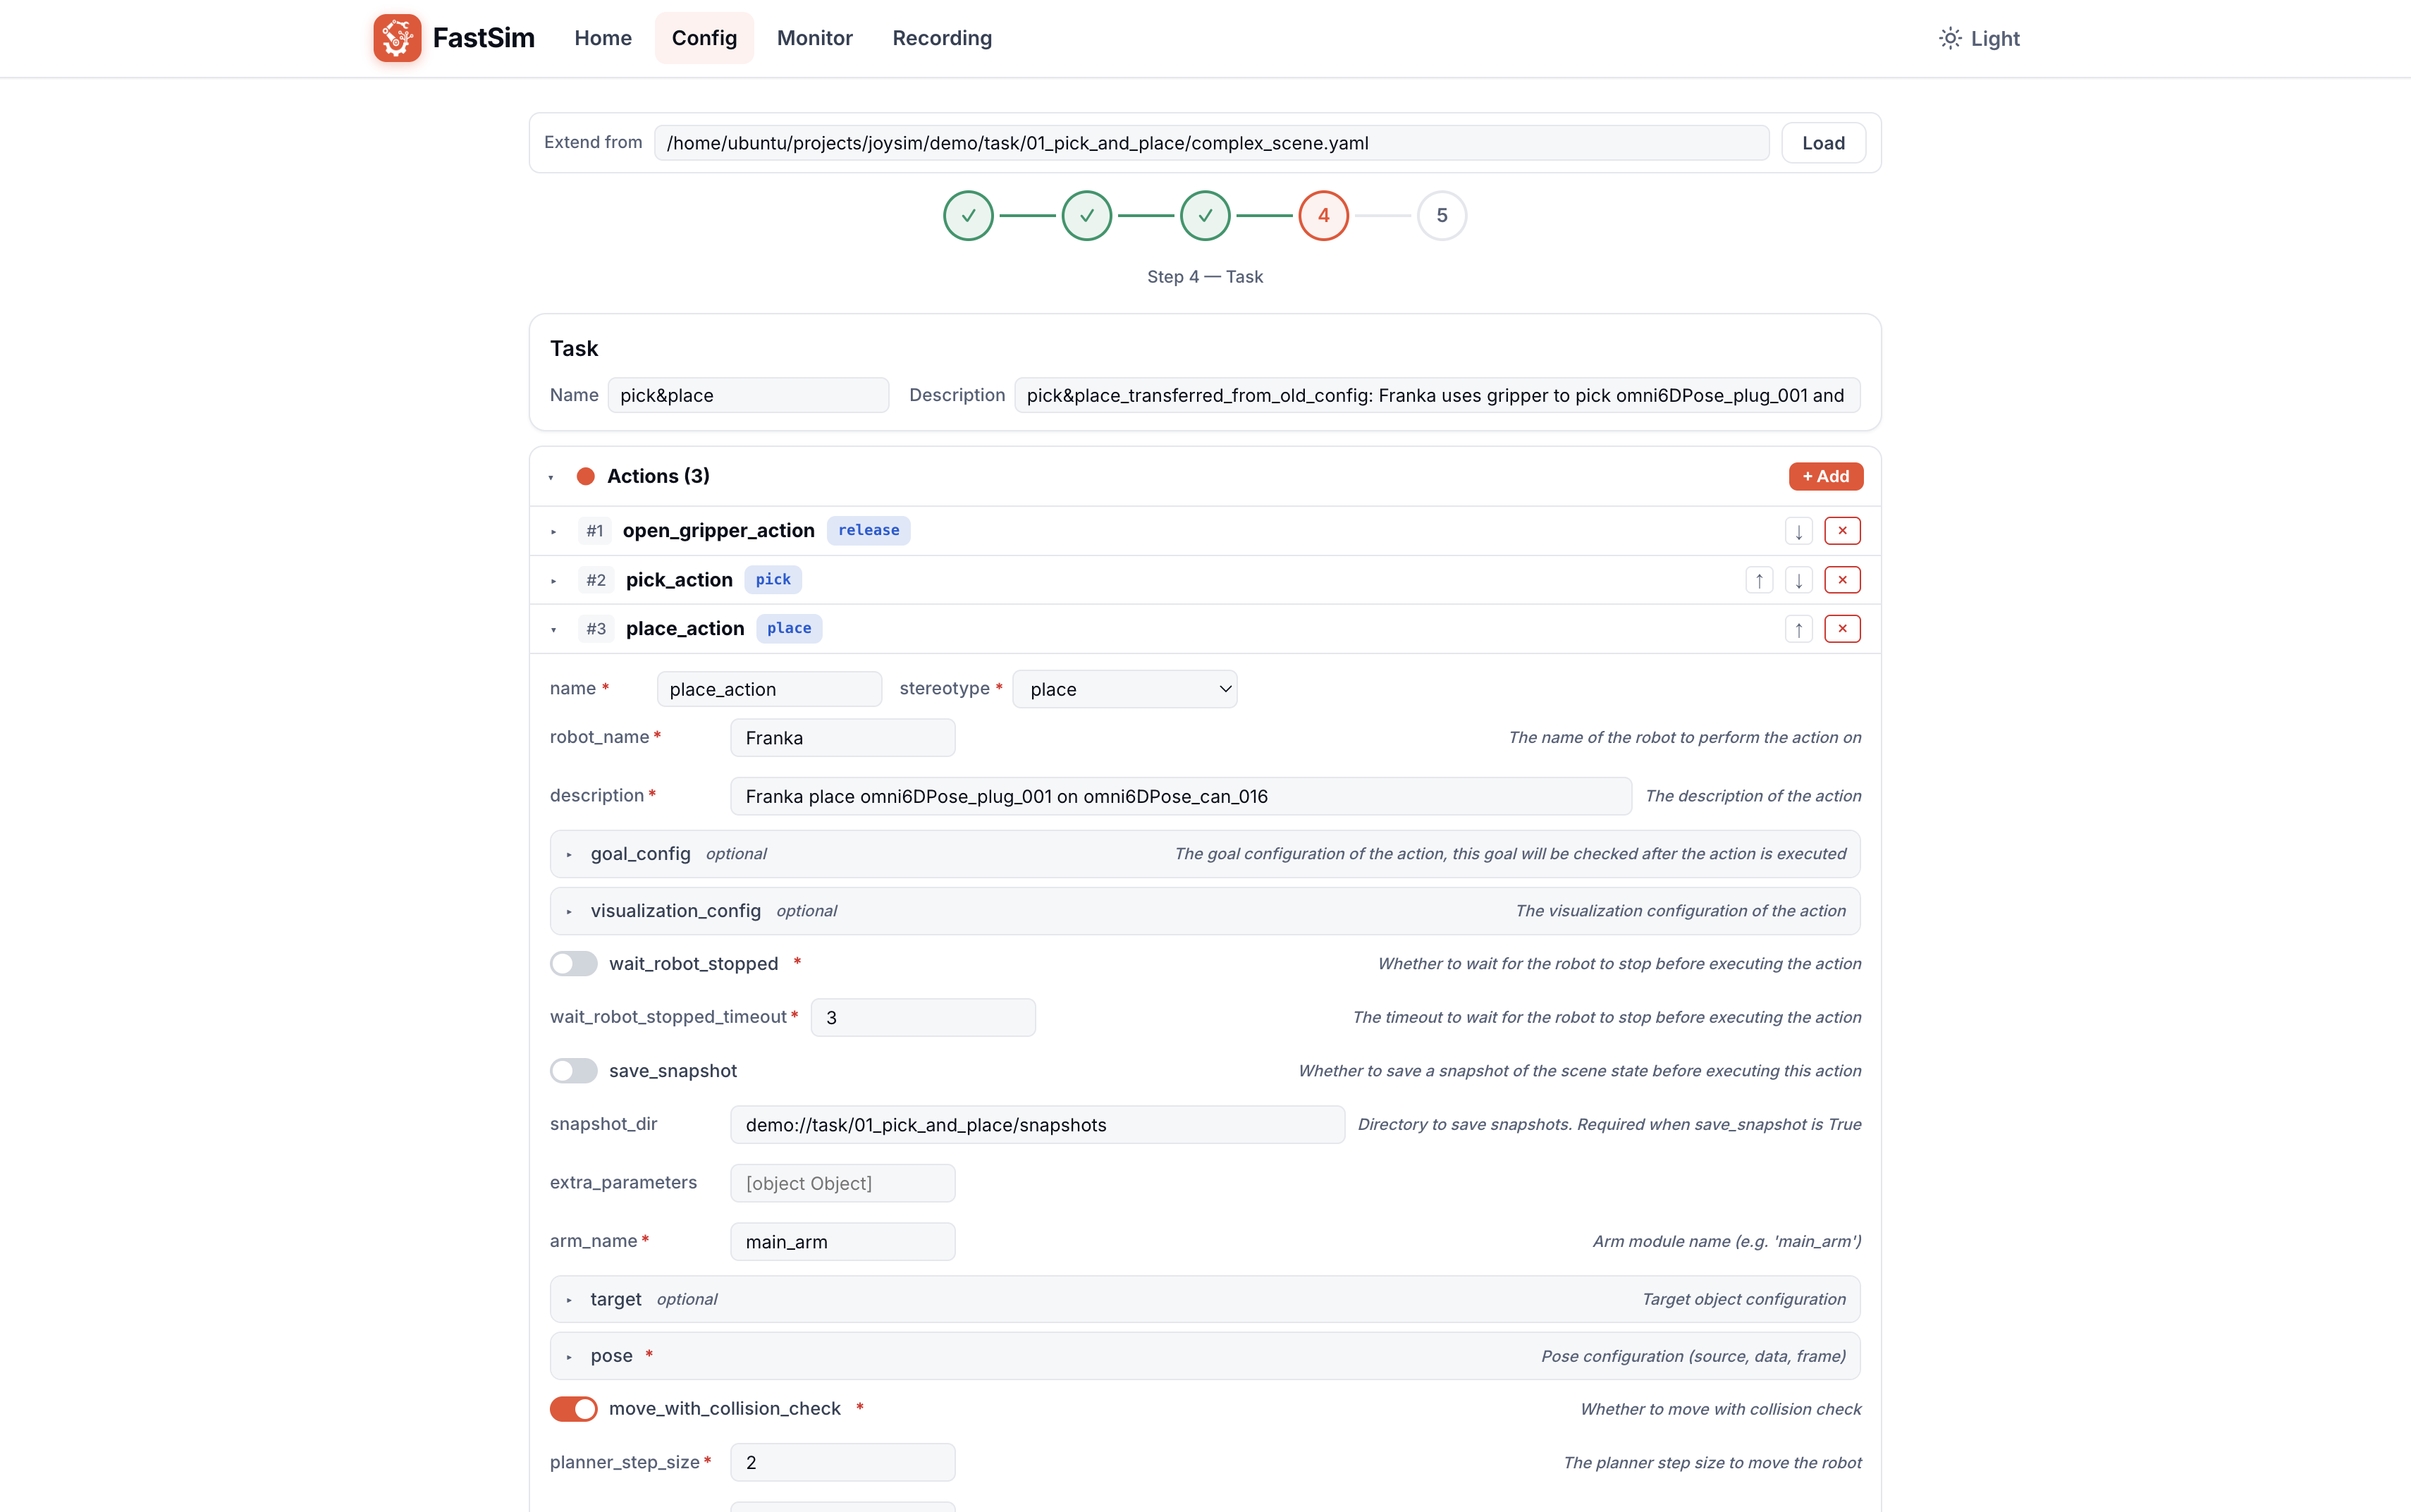
| Step 4 | Task | Action sequences and goal conditions |
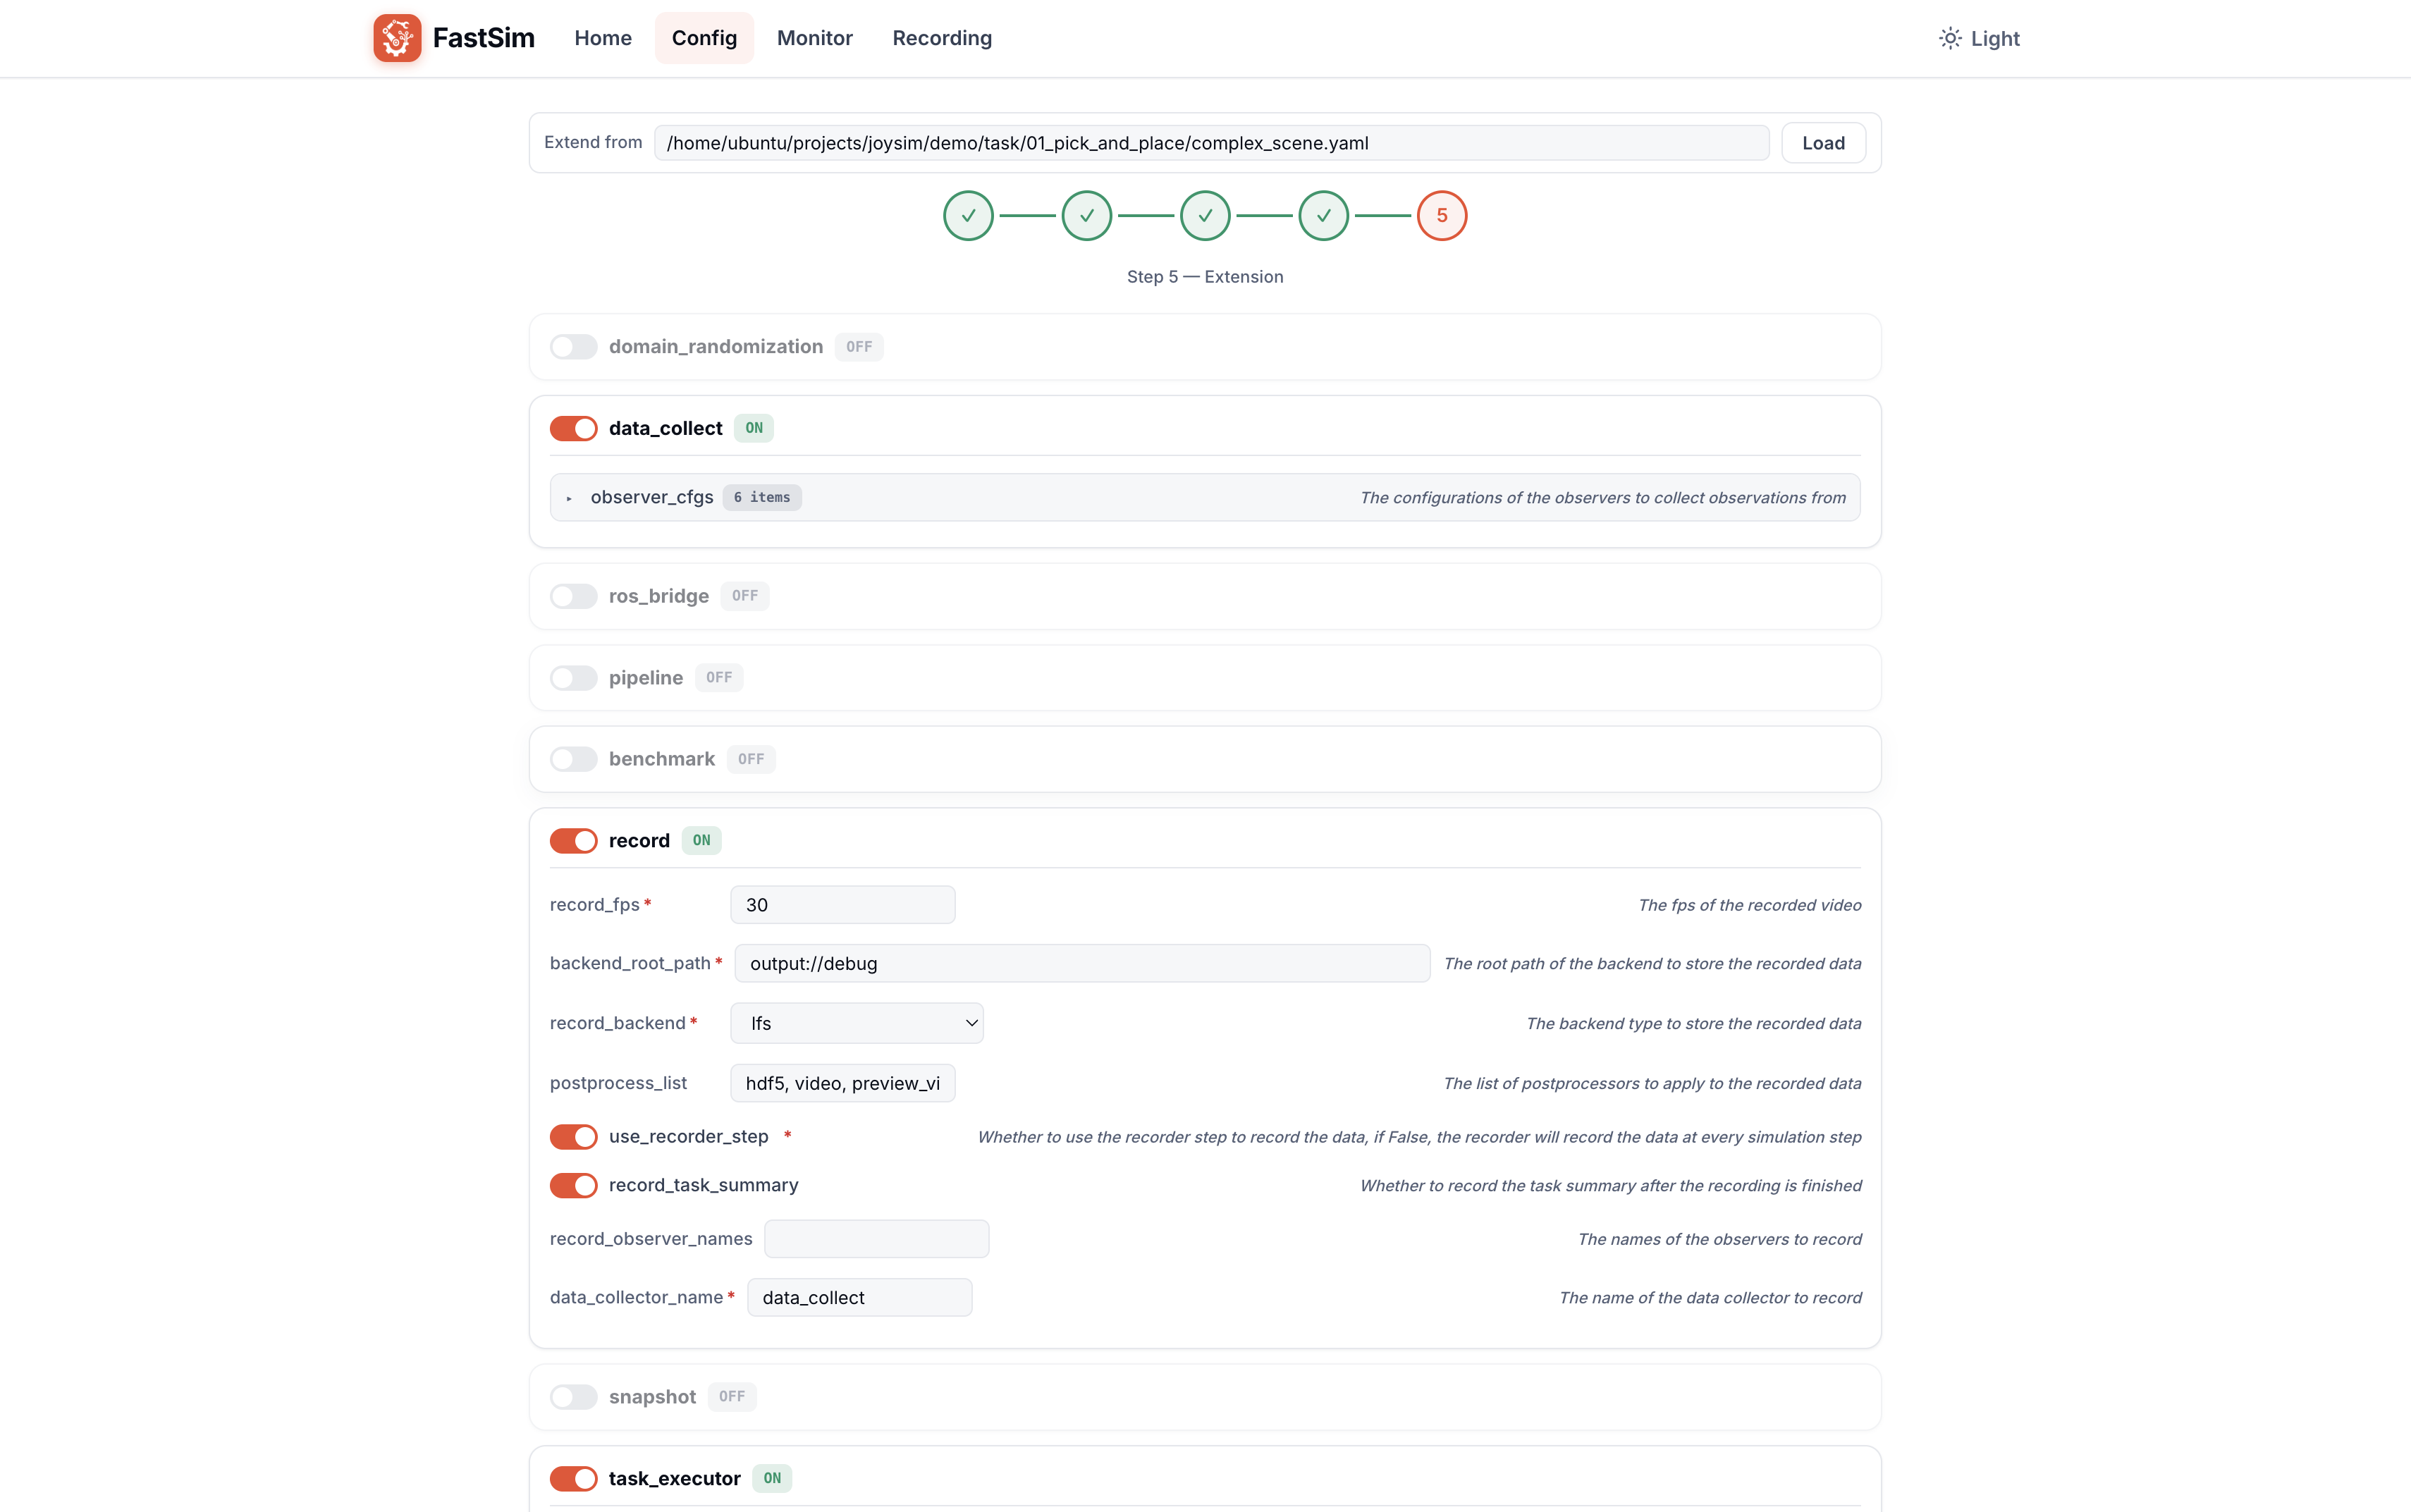
| Step 5 | Extension | Recording, teleoperation, task executor, etc. |
Key Features
- Load existing configs: Enter a file path at the top; supports YAML / JSON /
.simformats - Dynamic form generation: Fields, types, defaults, and constraints are auto-extracted from source code stereotypes
- Live validation: Fields are validated as you type
- Multi-format export: Export as YAML, JSON, or
.sim
 点击放大
点击放大 The Task step lets you visually edit each action's full parameters, including nested sub-configs like MoveTargetConfig, MovePoseConfig, and PlannerAttachConfig.
 点击放大
点击放大 The Extension step shows all registered extension types with enable/disable toggles and detailed parameter editing (observer lists, recorder settings, etc.).
Monitor — Real-Time Monitoring
Live simulation state monitoring. The left sidebar provides four sub-panels: Overview, Detail, Charts, and API.
Starting a Simulation
Start a simulation directly from the Monitor page:
- Enter a config file path in the top address bar
- Click the Launch button in the top-right corner
- The simulation starts as a subprocess; state streams via WebSocket to the page
You can also edit a config in the Config page, save it, then switch to Monitor to launch.
Overview Panel
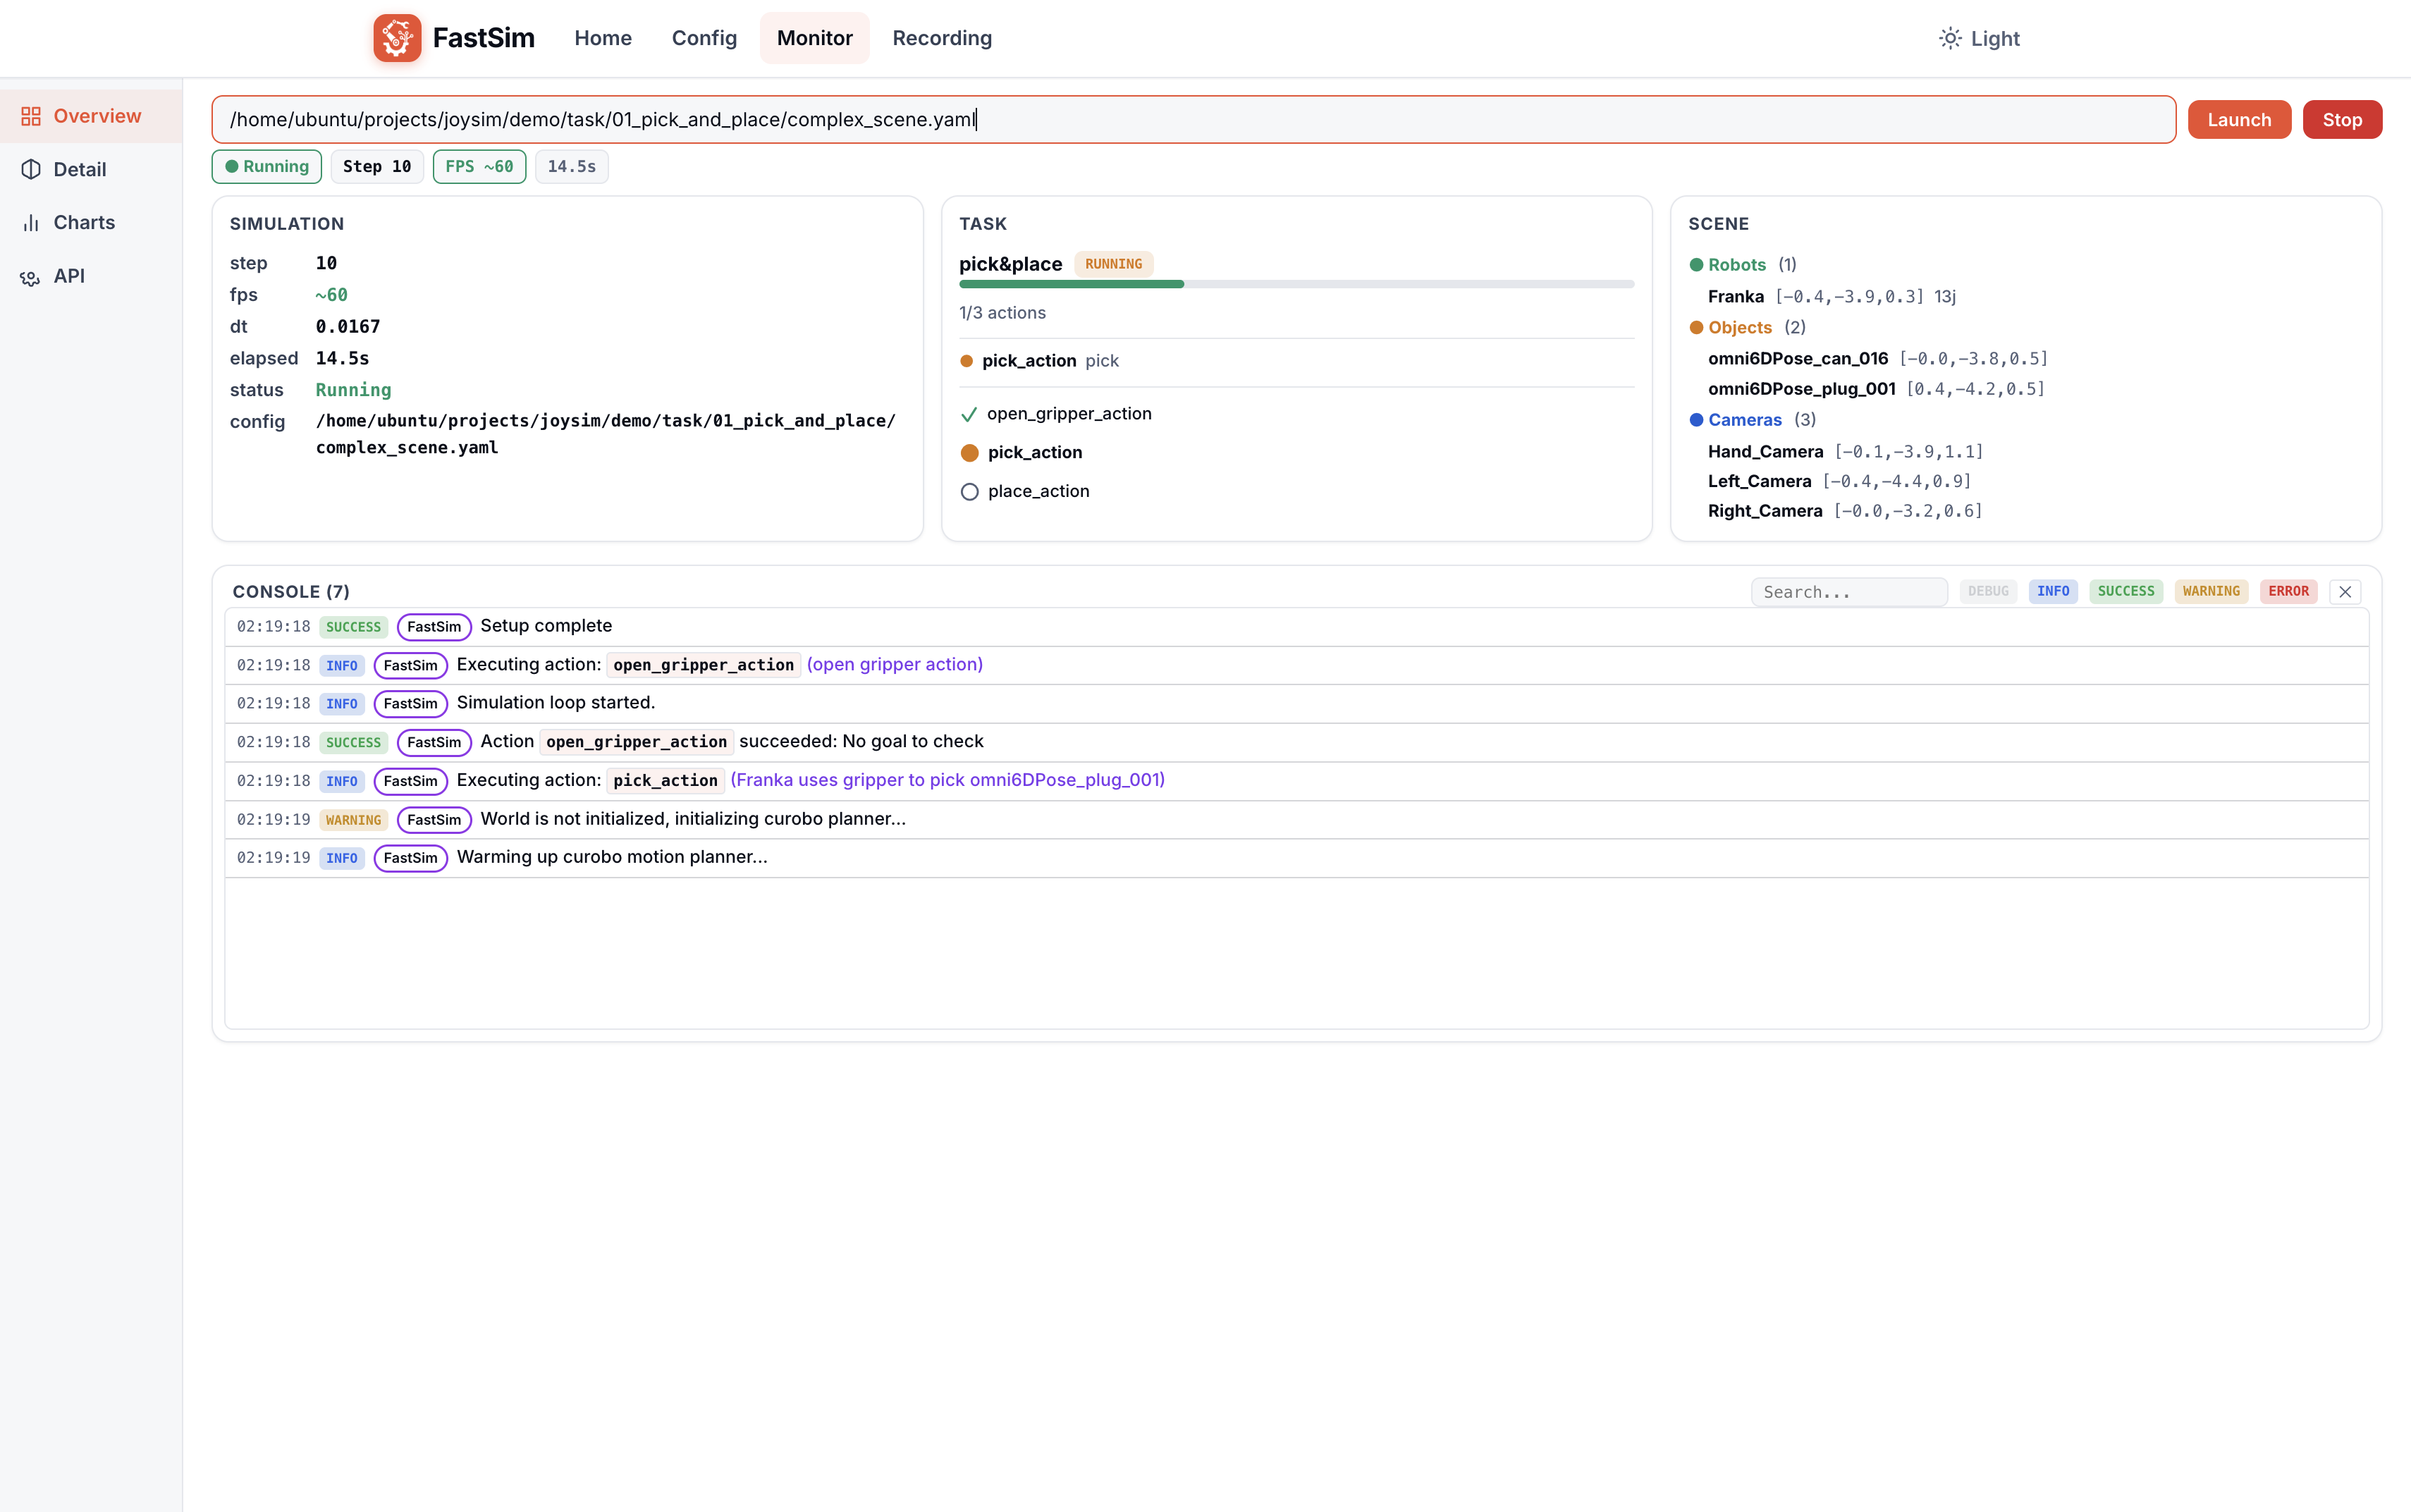 点击放大
点击放大 The Overview panel provides a global view of the running simulation with four areas:
| Area | Content |
|---|---|
| SIMULATION | Step count, FPS, dt, elapsed time, config file path |
| TASK | Task name and description, action list with execution status (waiting/running/done), displayed as a timeline |
| SCENE | Entity summary — robots (position/rotation), objects, sensors, updated in real time |
| CONSOLE | Real-time log stream, color-coded by level (DEBUG/INFO/WARNING/ERROR), with timestamps and source modules |
Launch and Stop buttons are in the top-right corner.
Detail Panel
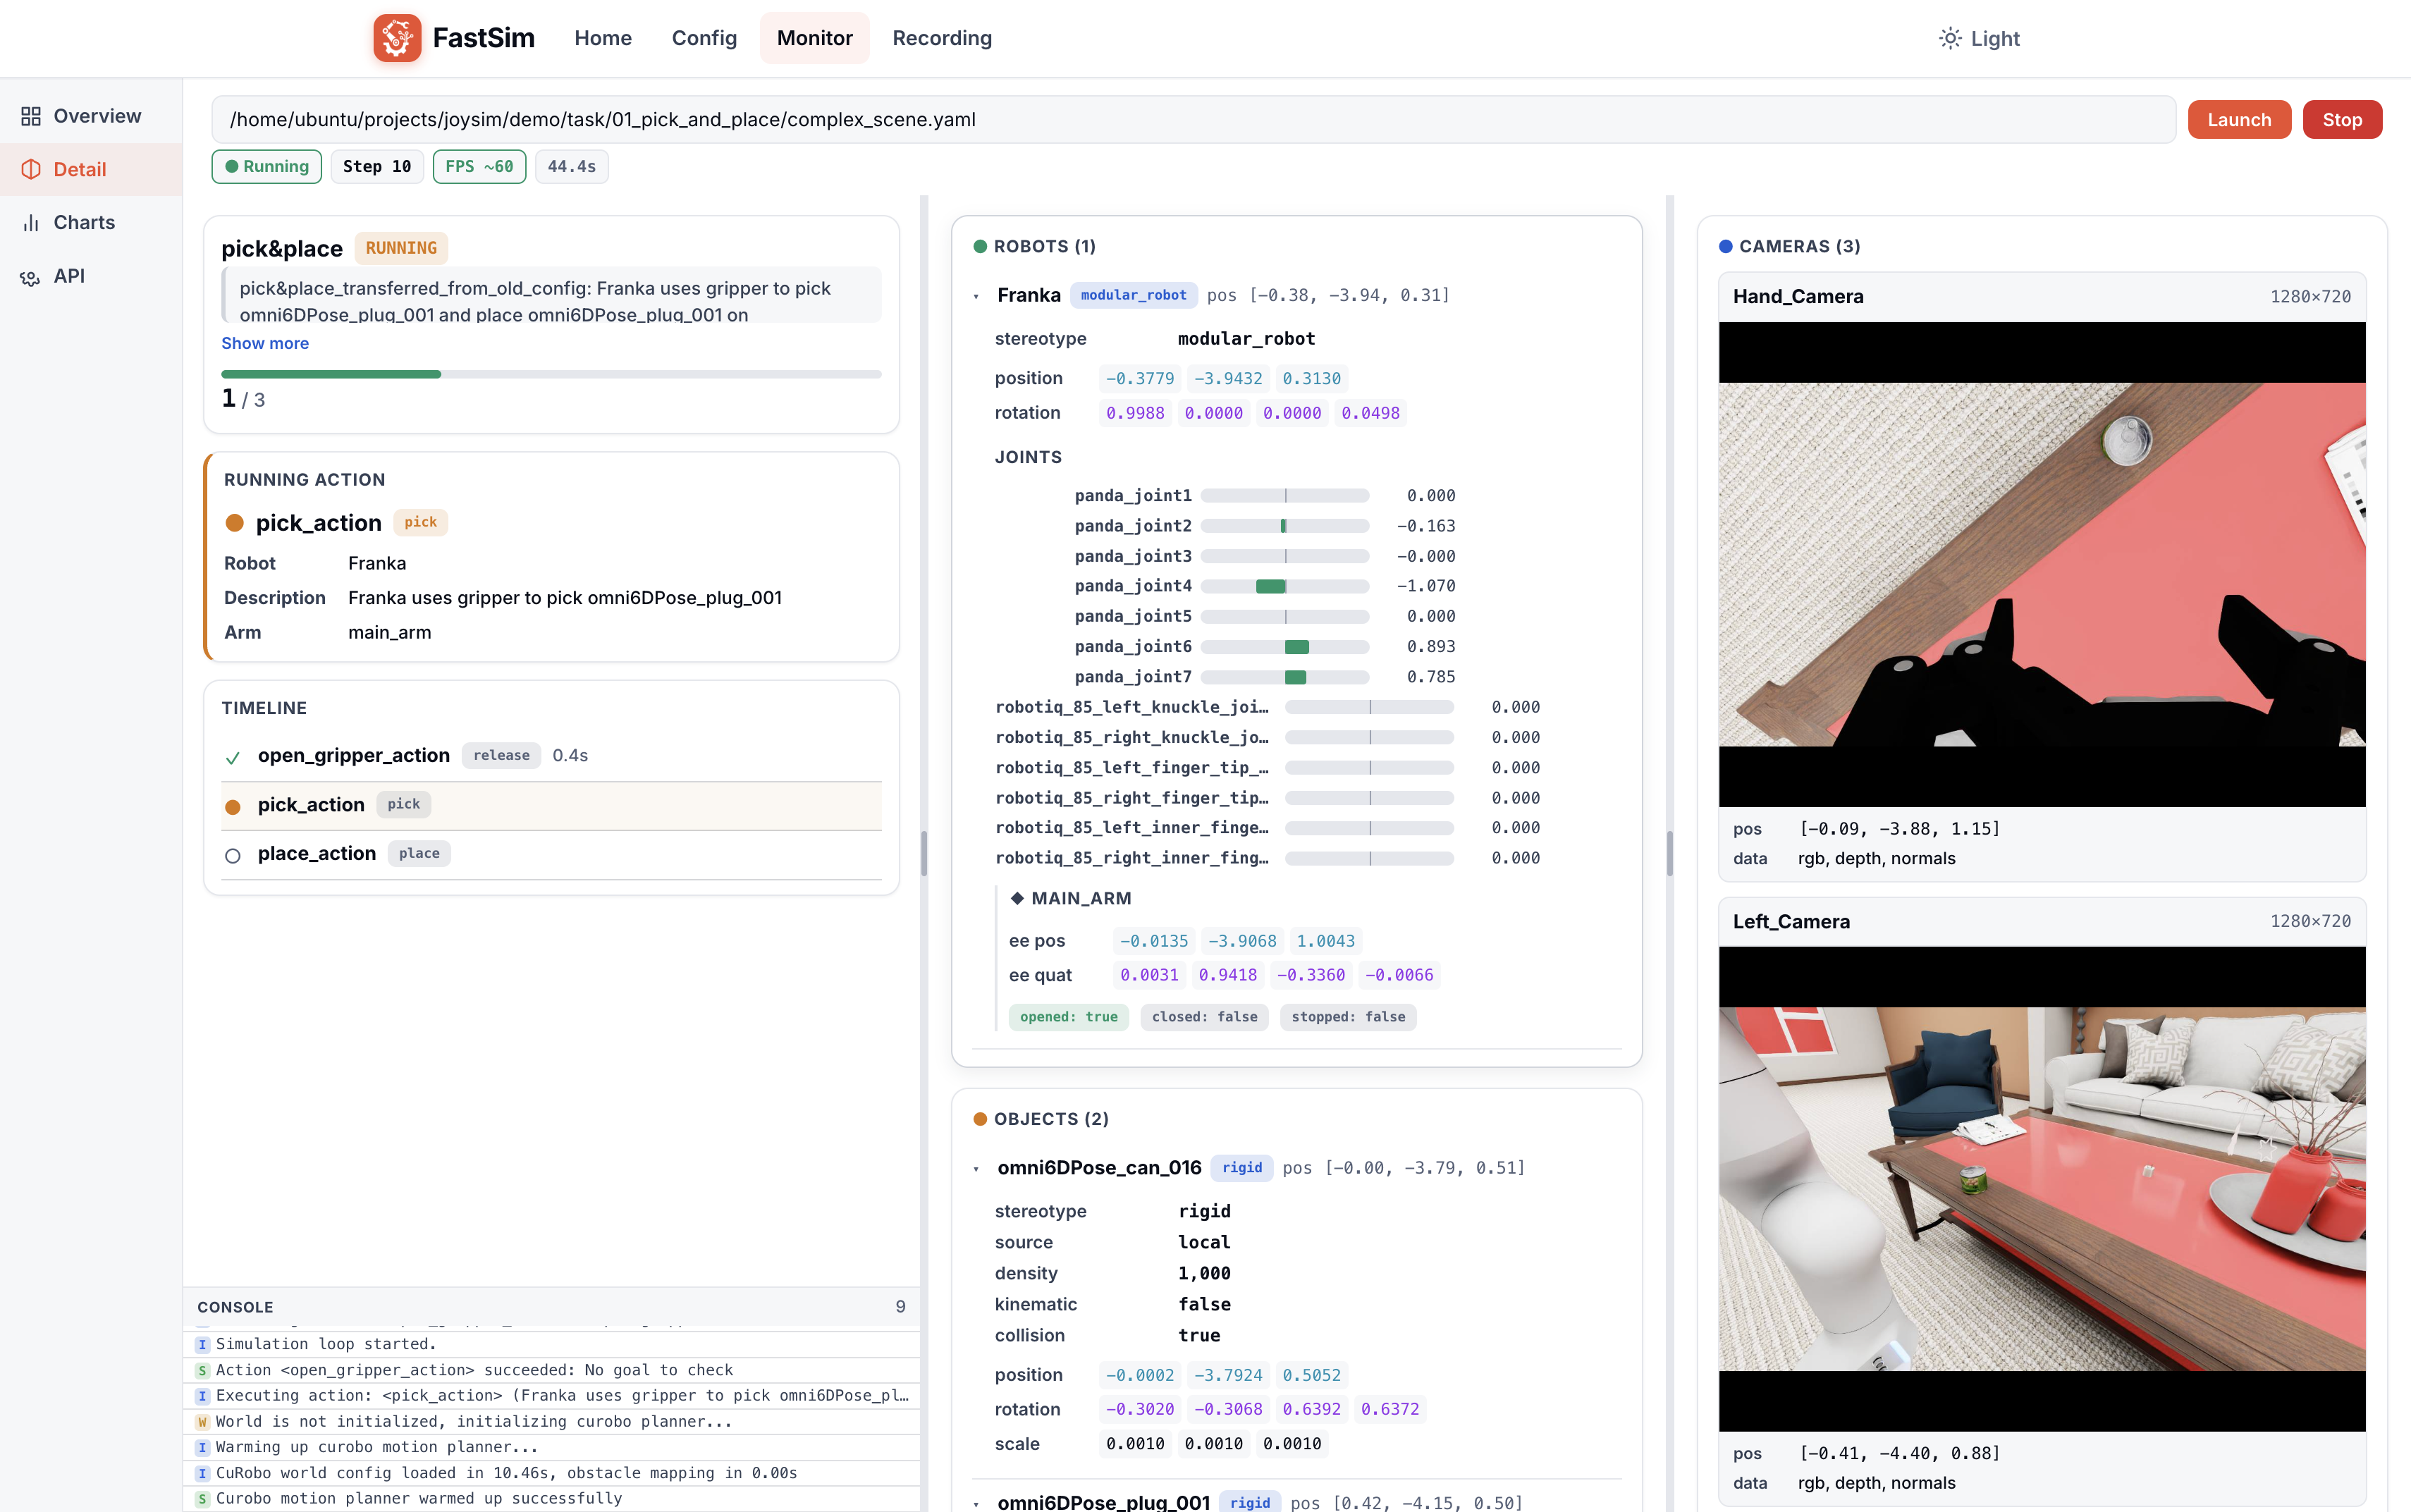 点击放大
点击放大 The Detail panel provides deep state inspection for every entity in the simulation:
- Robot state: Per-joint position values with progress bar visualization, end-effector pose (position xyz + quaternion wxyz), multi-arm support
- Object state: Position, rotation, stereotype tag, physics properties (mass / density / kinematic, etc.)
- Camera feeds: Live camera images grouped by name, showing resolution and data types (rgb / depth / normals); click to enlarge
Charts Panel
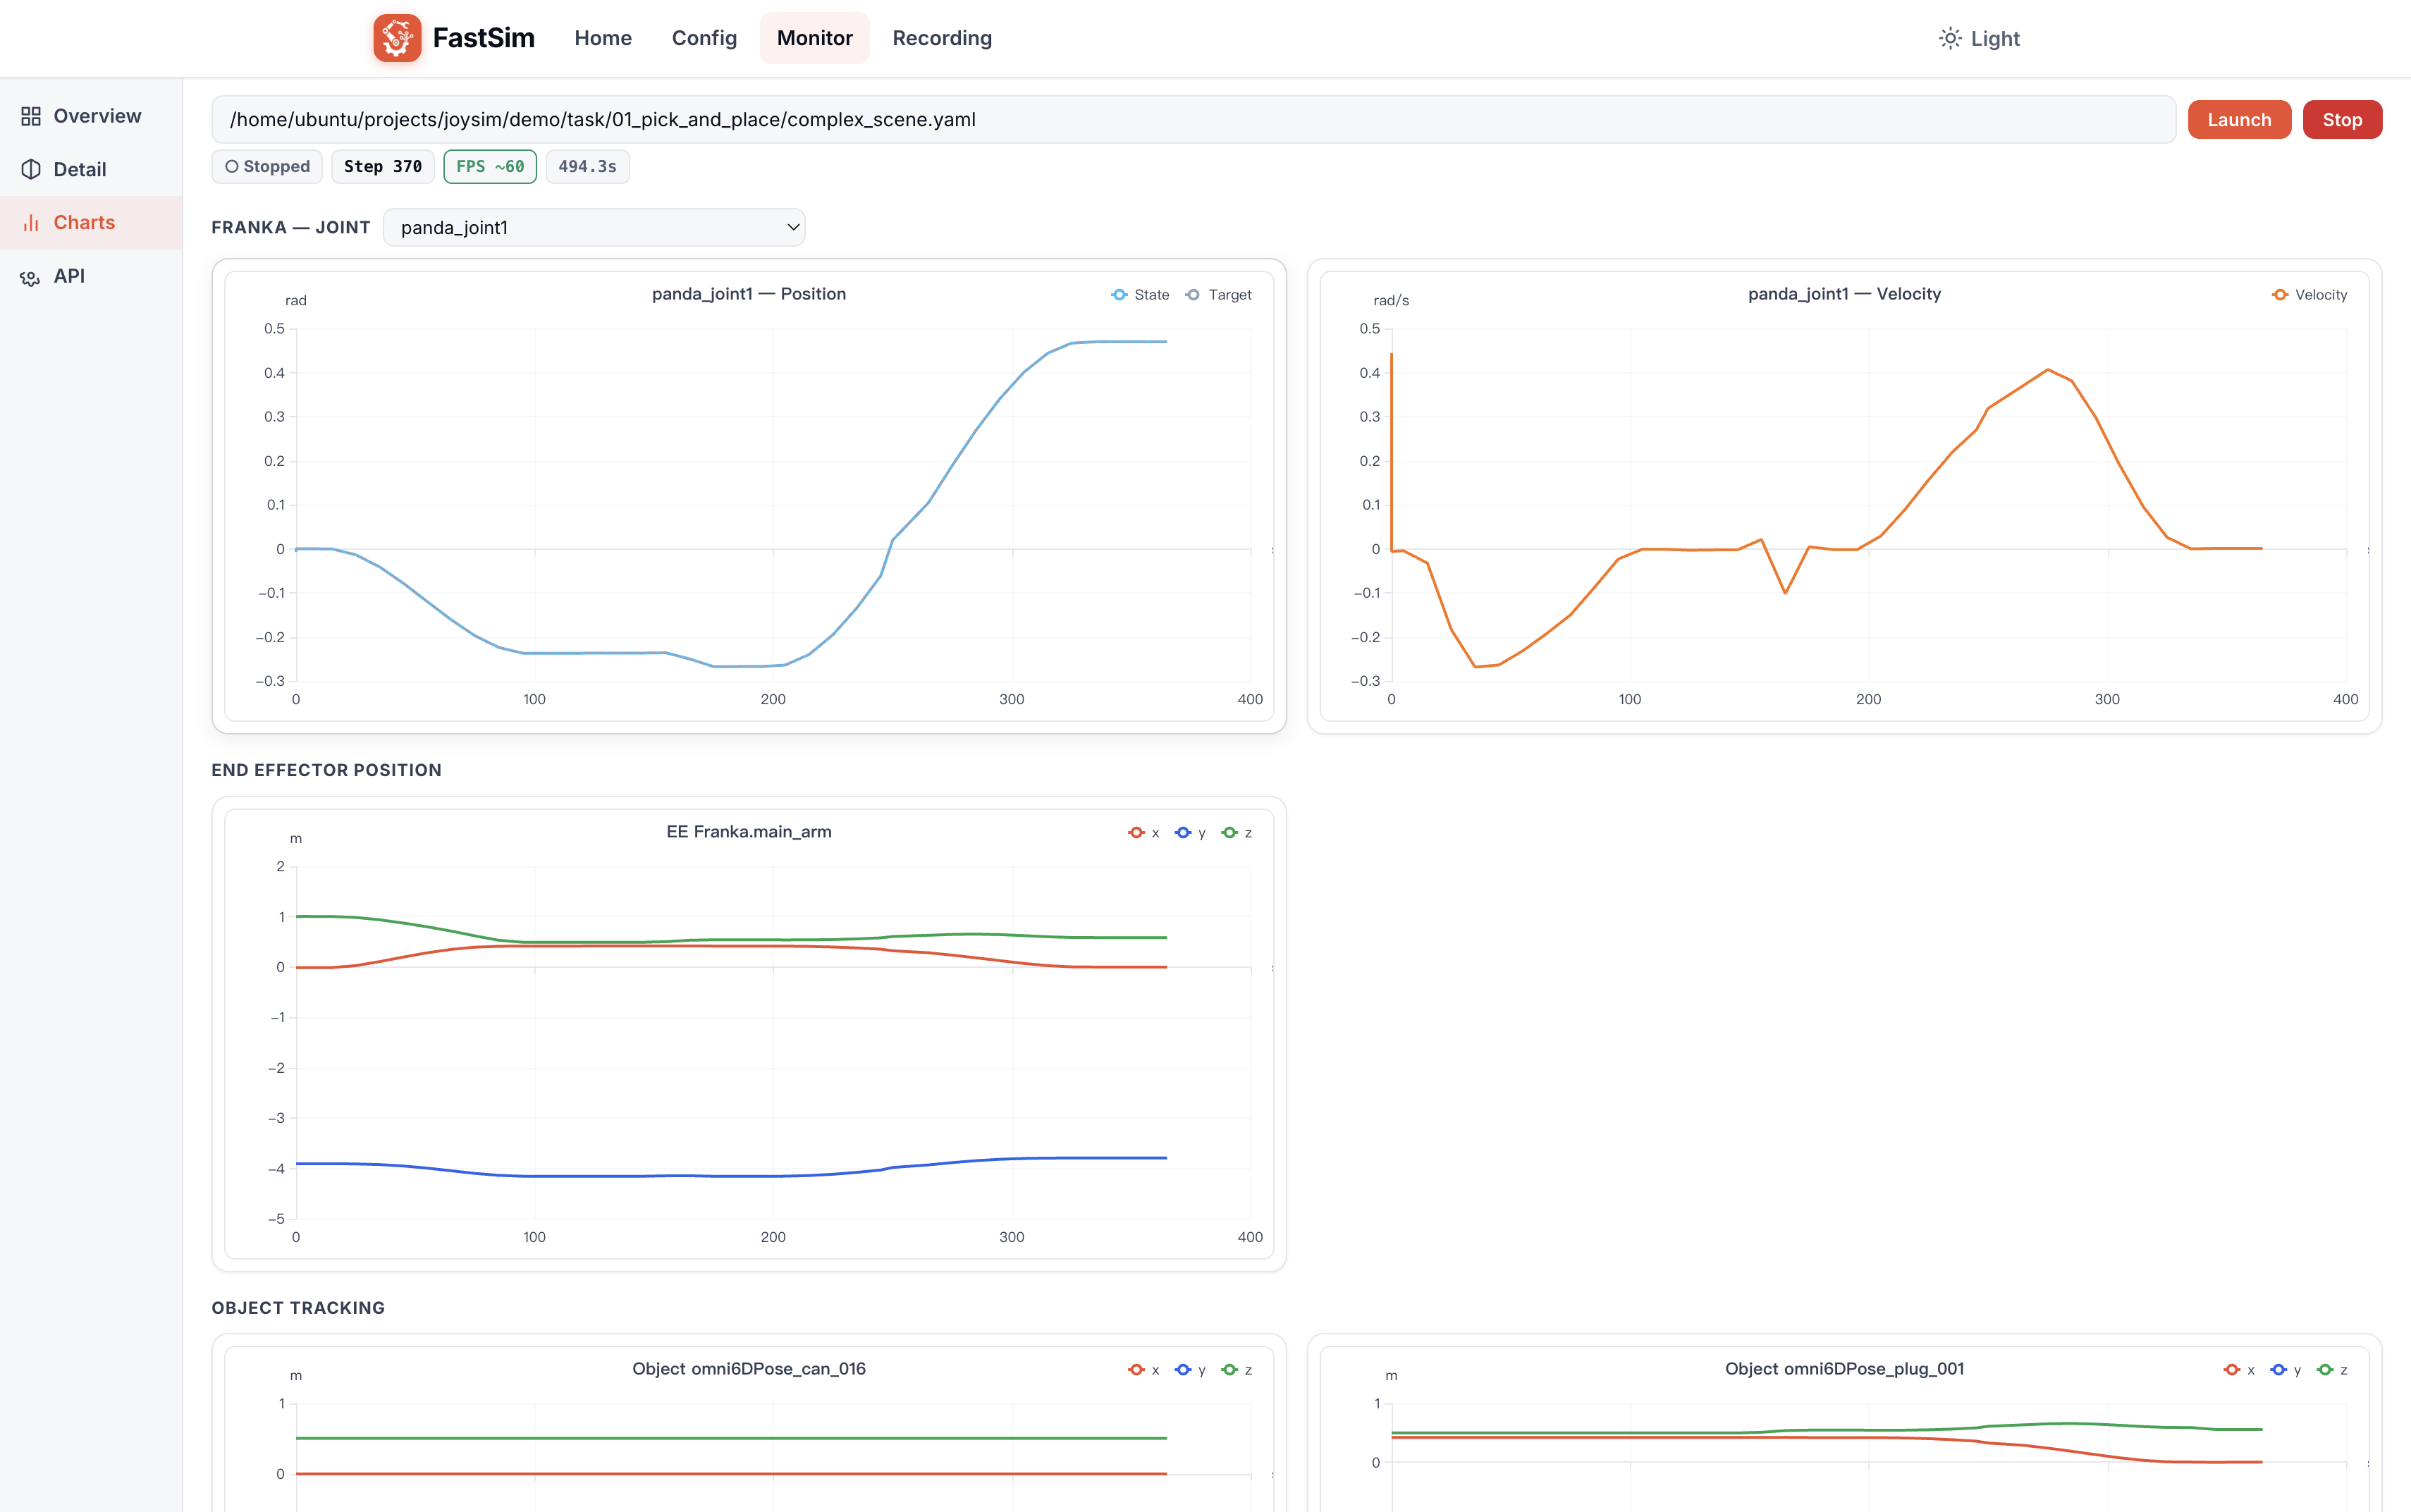 点击放大
点击放大 Real-time data charts visualizing simulation dynamics:
- Joint position/velocity curves: Select a robot and joint to plot real-time trajectories (Position and Velocity side by side)
- End-effector position: EE xyz position over time
- Object tracking: Real-time position curves for scene objects
Select the target robot and joint at the top; charts update automatically.
API Panel
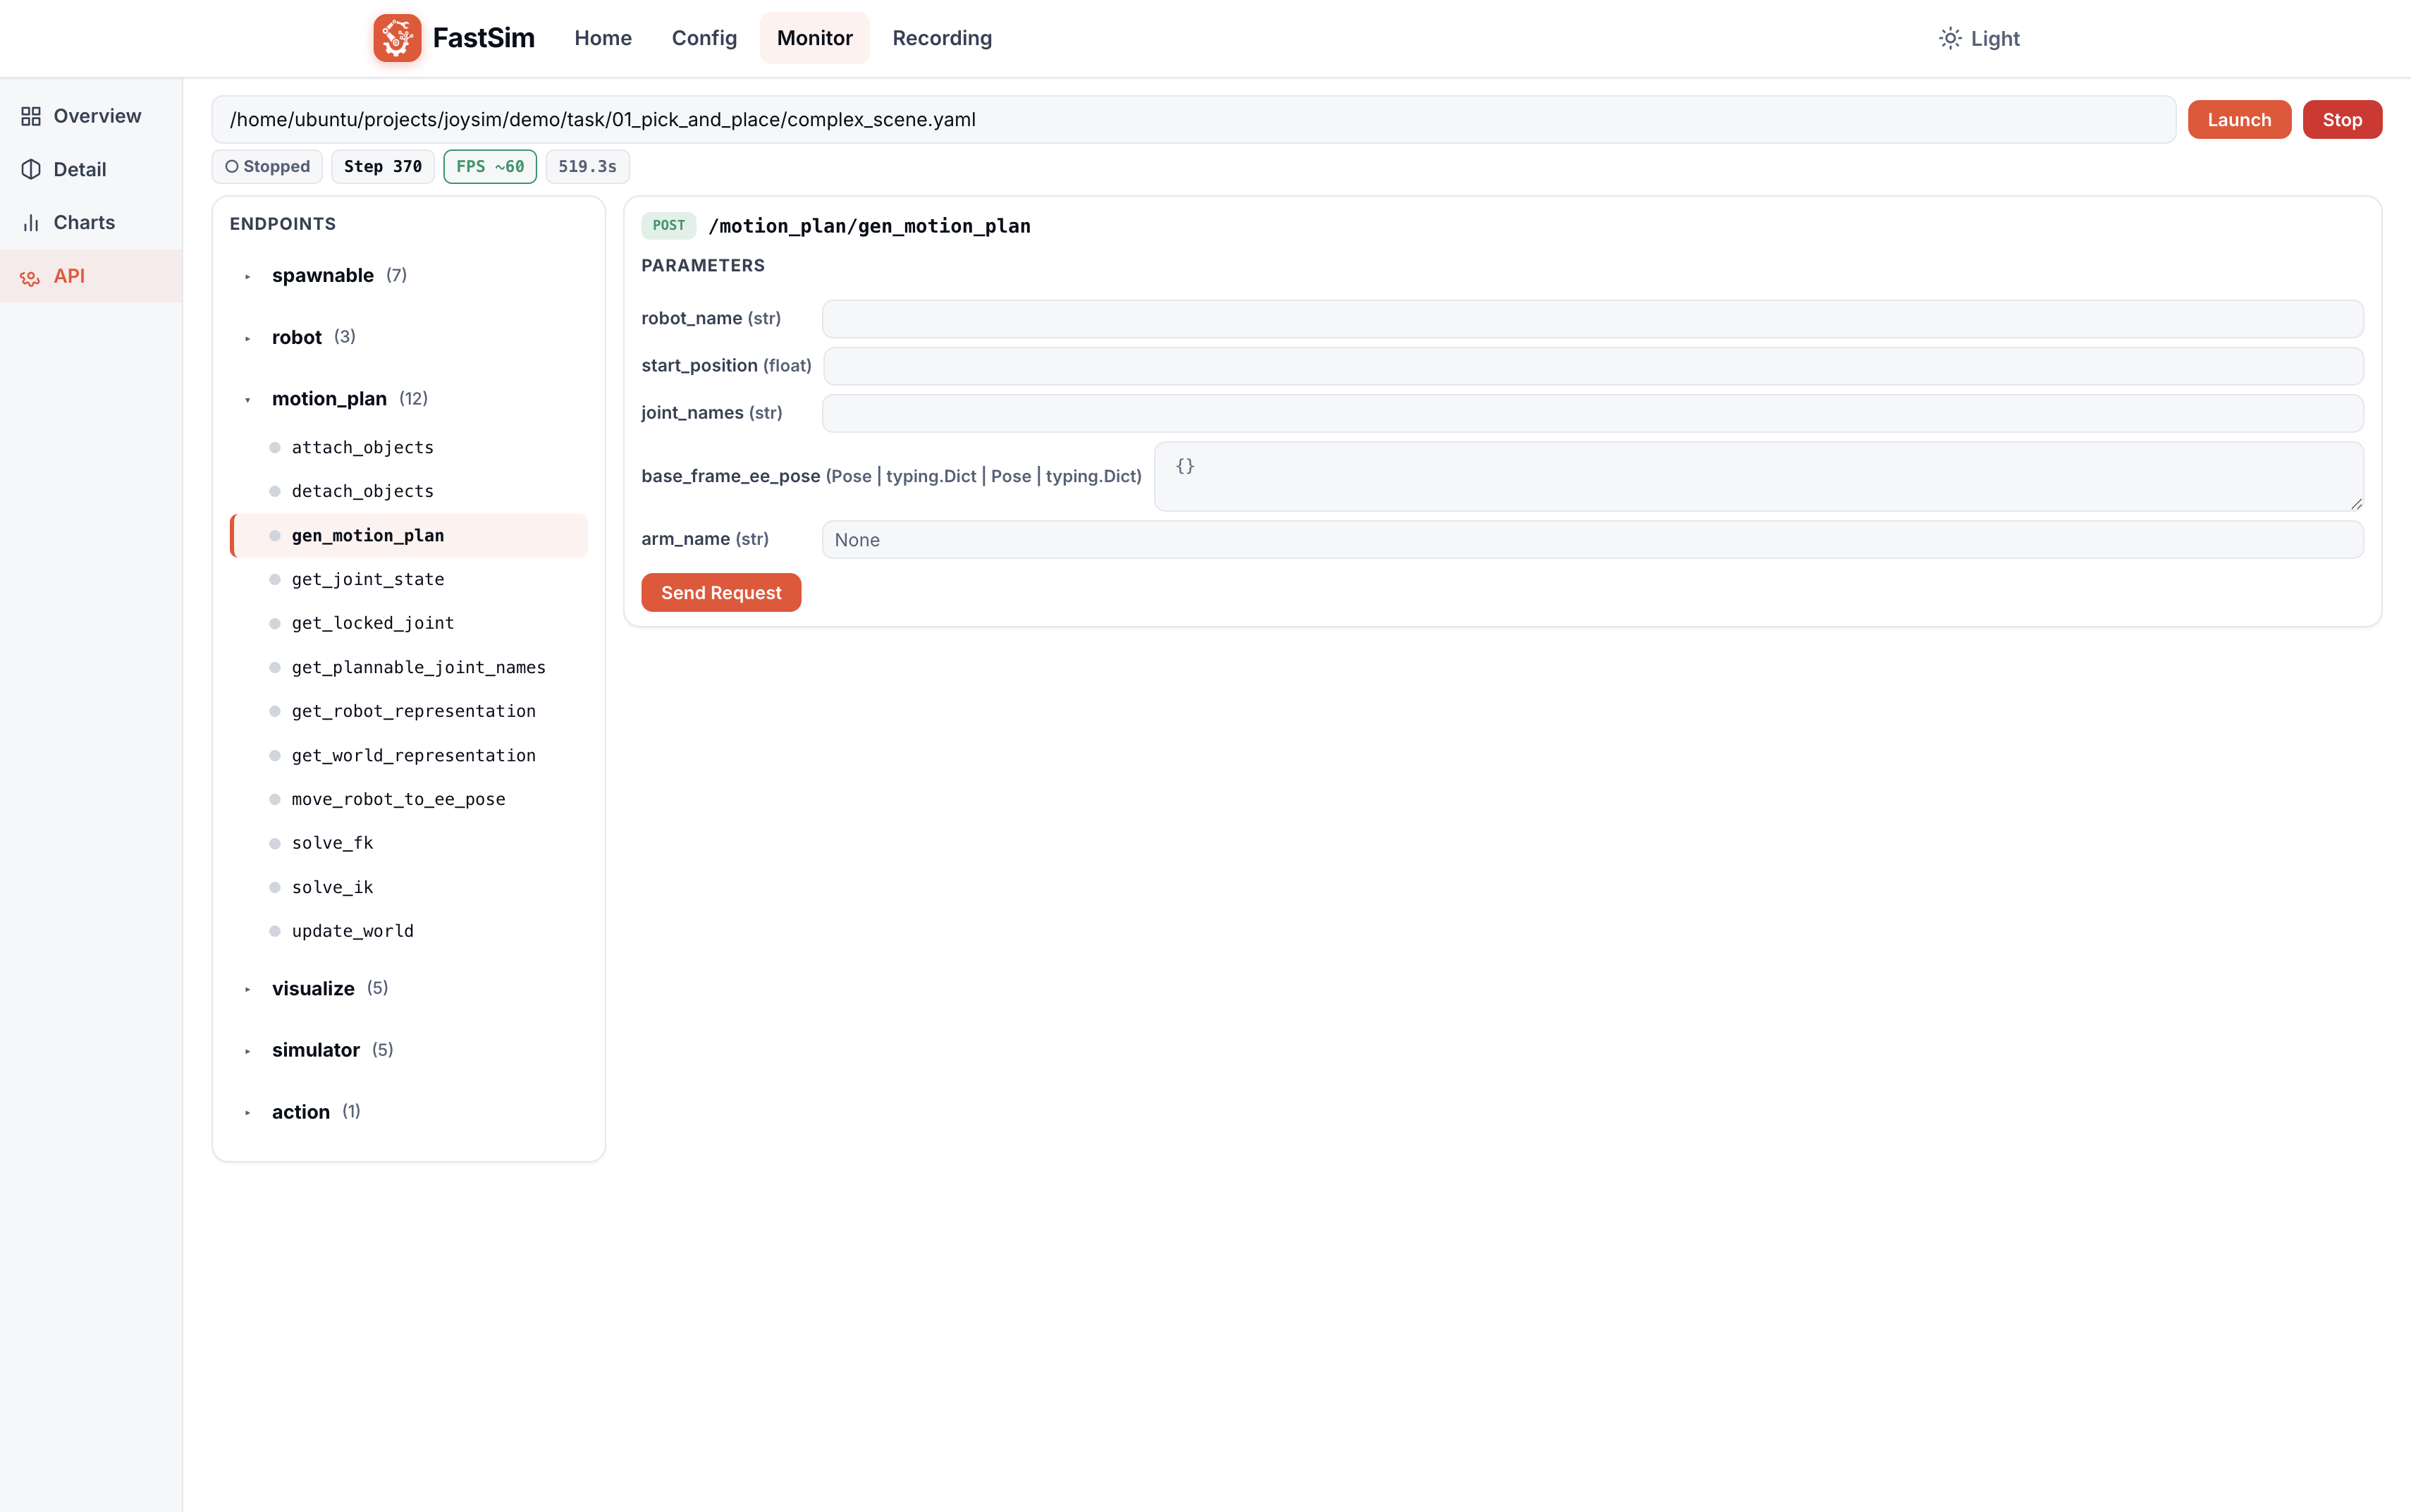 点击放大
点击放大 Built-in REST API browser for calling simulation controller methods directly from the browser:
- Left tree directory: Lists all available API endpoints grouped by controller (spawnable / robot / motion_plan / visualize / simulator / action, etc.)
- Right call panel: Shows the parameter form for the selected endpoint; fill in parameters and click Send Request to execute
- Parameter types are auto-detected (string, number, boolean, enum options, etc.)
- Responses are displayed in JSON format
This panel is equivalent to using curl against the simulation's built-in REST API (port 5000), but with a graphical interface for parameter entry and response viewing.
Recording — Recording Viewer
Post-simulation recording analysis tool supporting task review, video playback, HDF5 data browsing, and trajectory curve analysis.
Loading a Recording
Enter the recording output directory path at the top, then click Load. The system automatically discovers task_summary.json, HDF5 files, and video files in the directory.
Task Summary & Recorded Videos
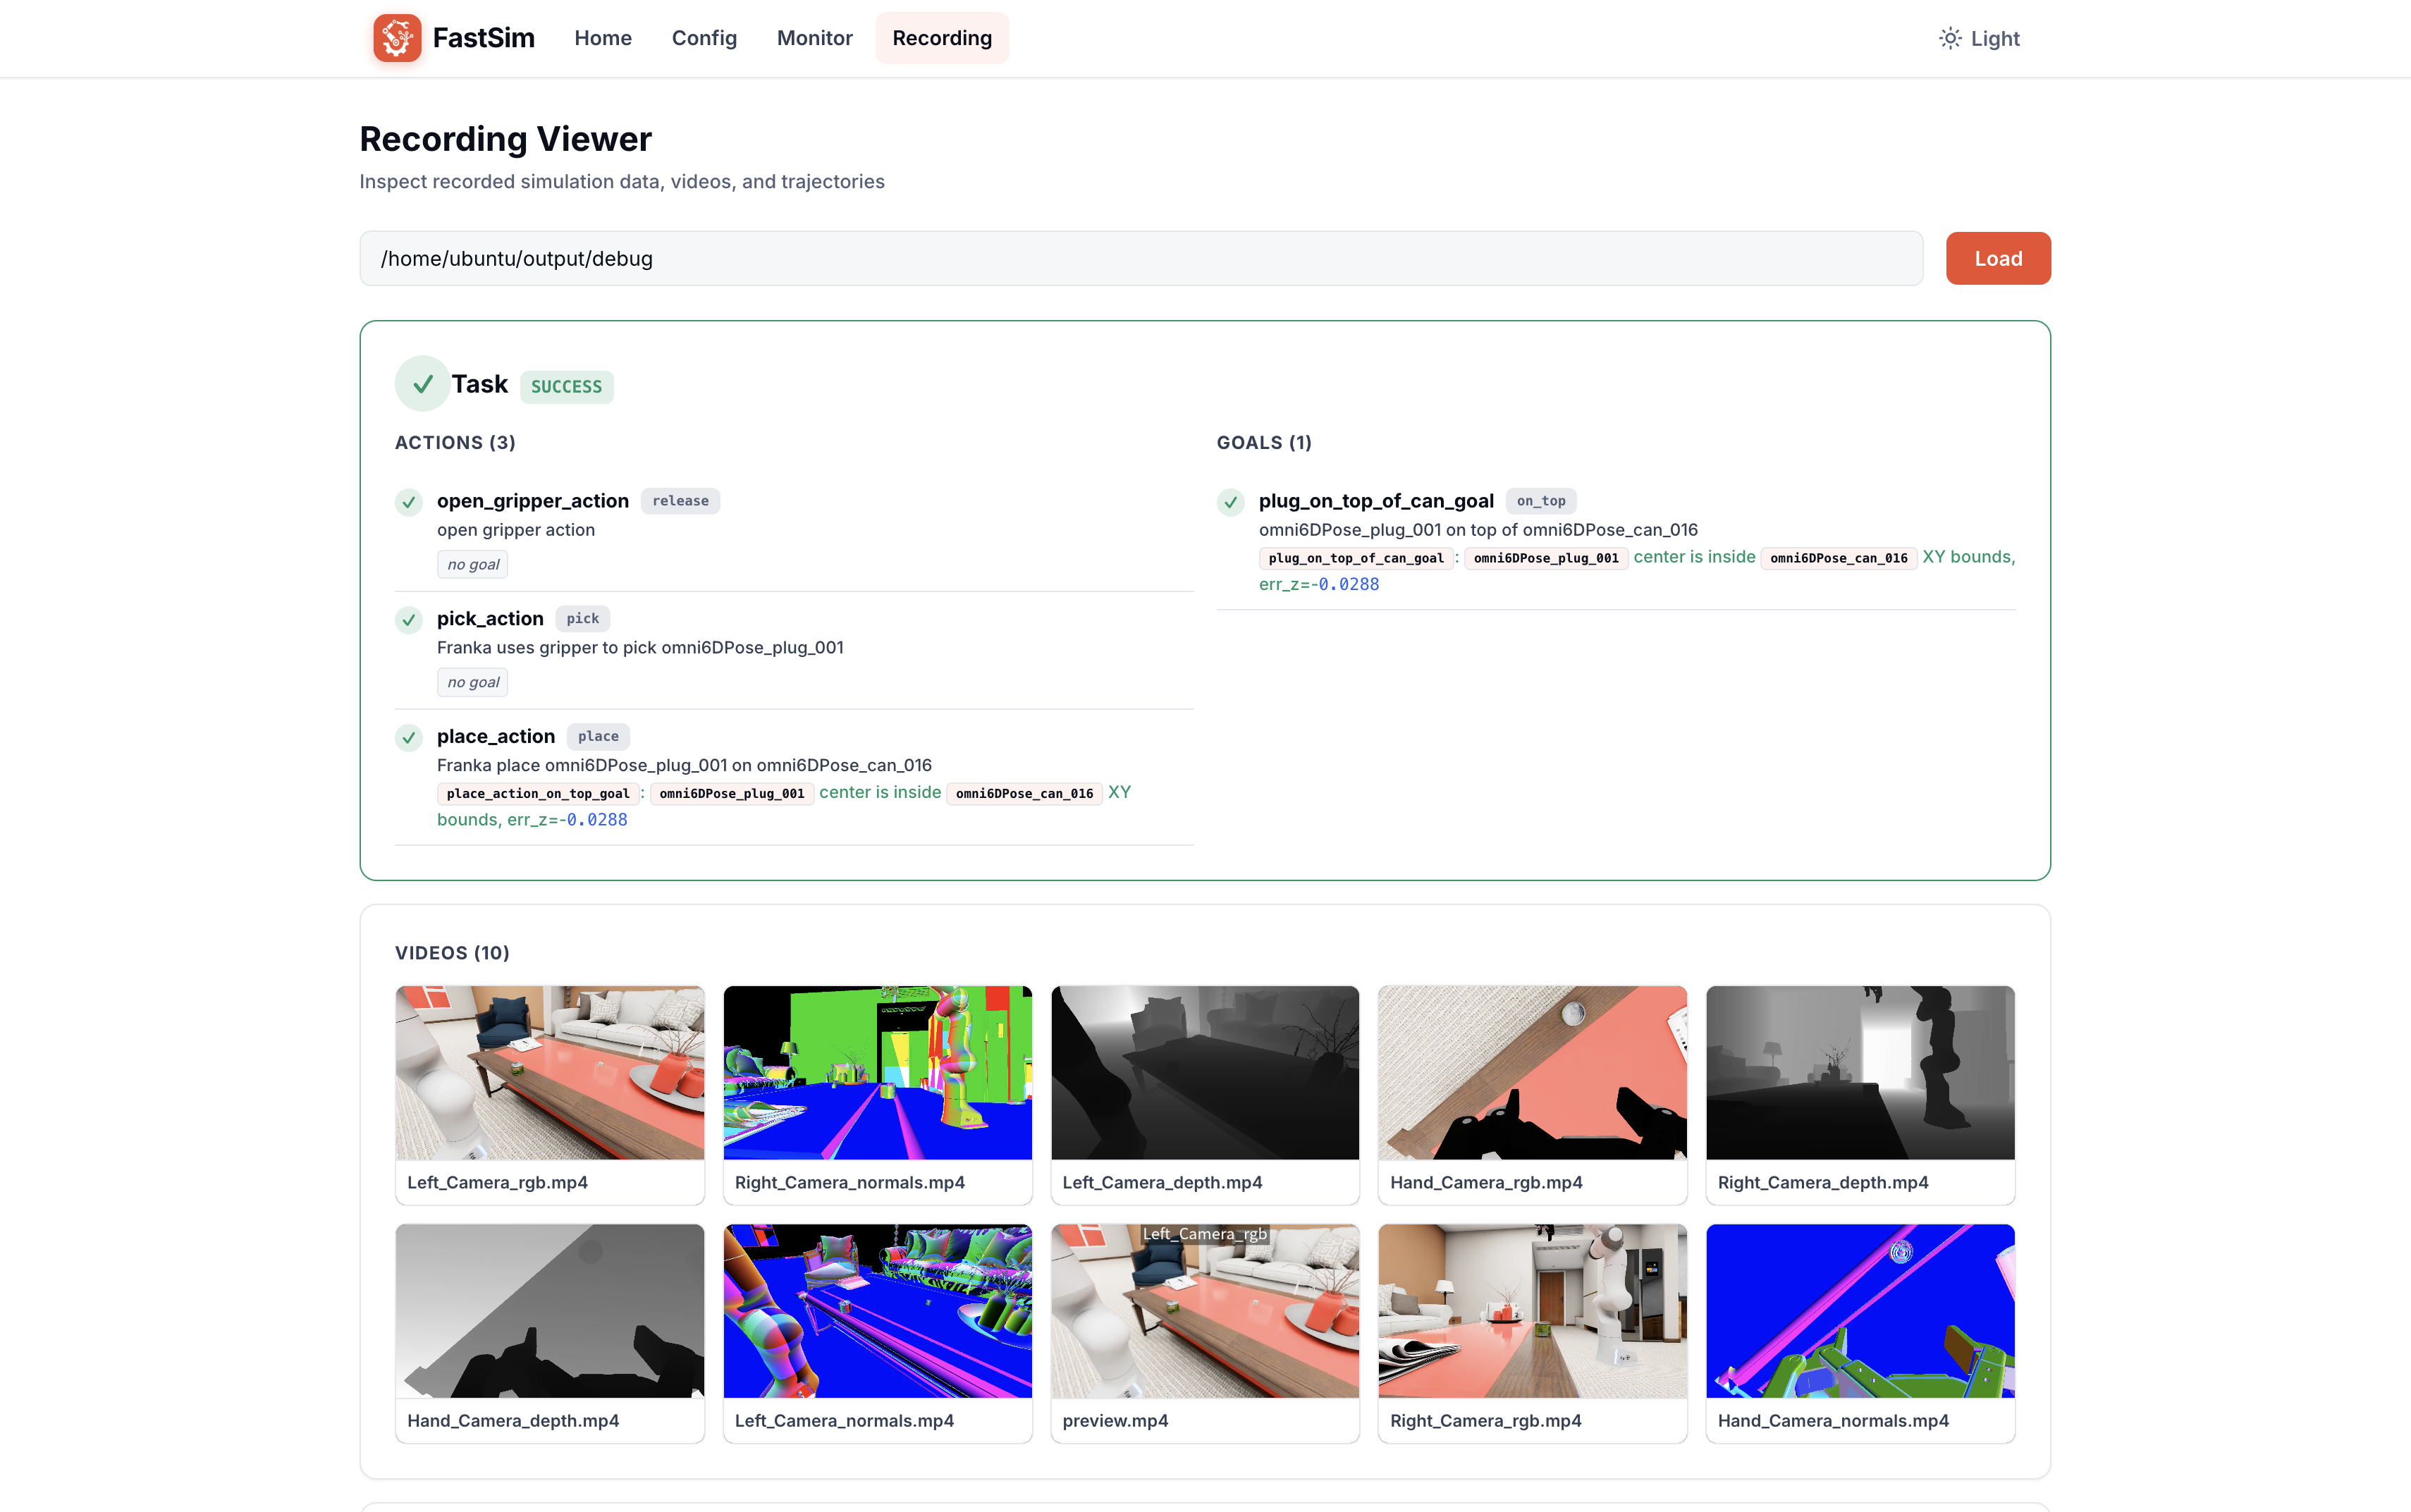 点击放大
点击放大 The top section shows the task summary:
- ACTIONS: Lists all executed actions with stereotype tags (e.g., release / pick / place), description text, target objects, and per-action goal evaluation results
- GOALS: Shows final goal condition results (pass/fail) with specific evaluation parameters (position offsets, object matching, etc.)
The bottom section shows recorded videos:
- Automatically discovers all
.mp4video files, displayed as a thumbnail grid - Supports multi-camera (Hand_Camera / Left_Camera / Right_Camera, etc.) × multi-data-type (rgb / depth / normals) video combinations
- Click any thumbnail to play
HDF5 Data Browser
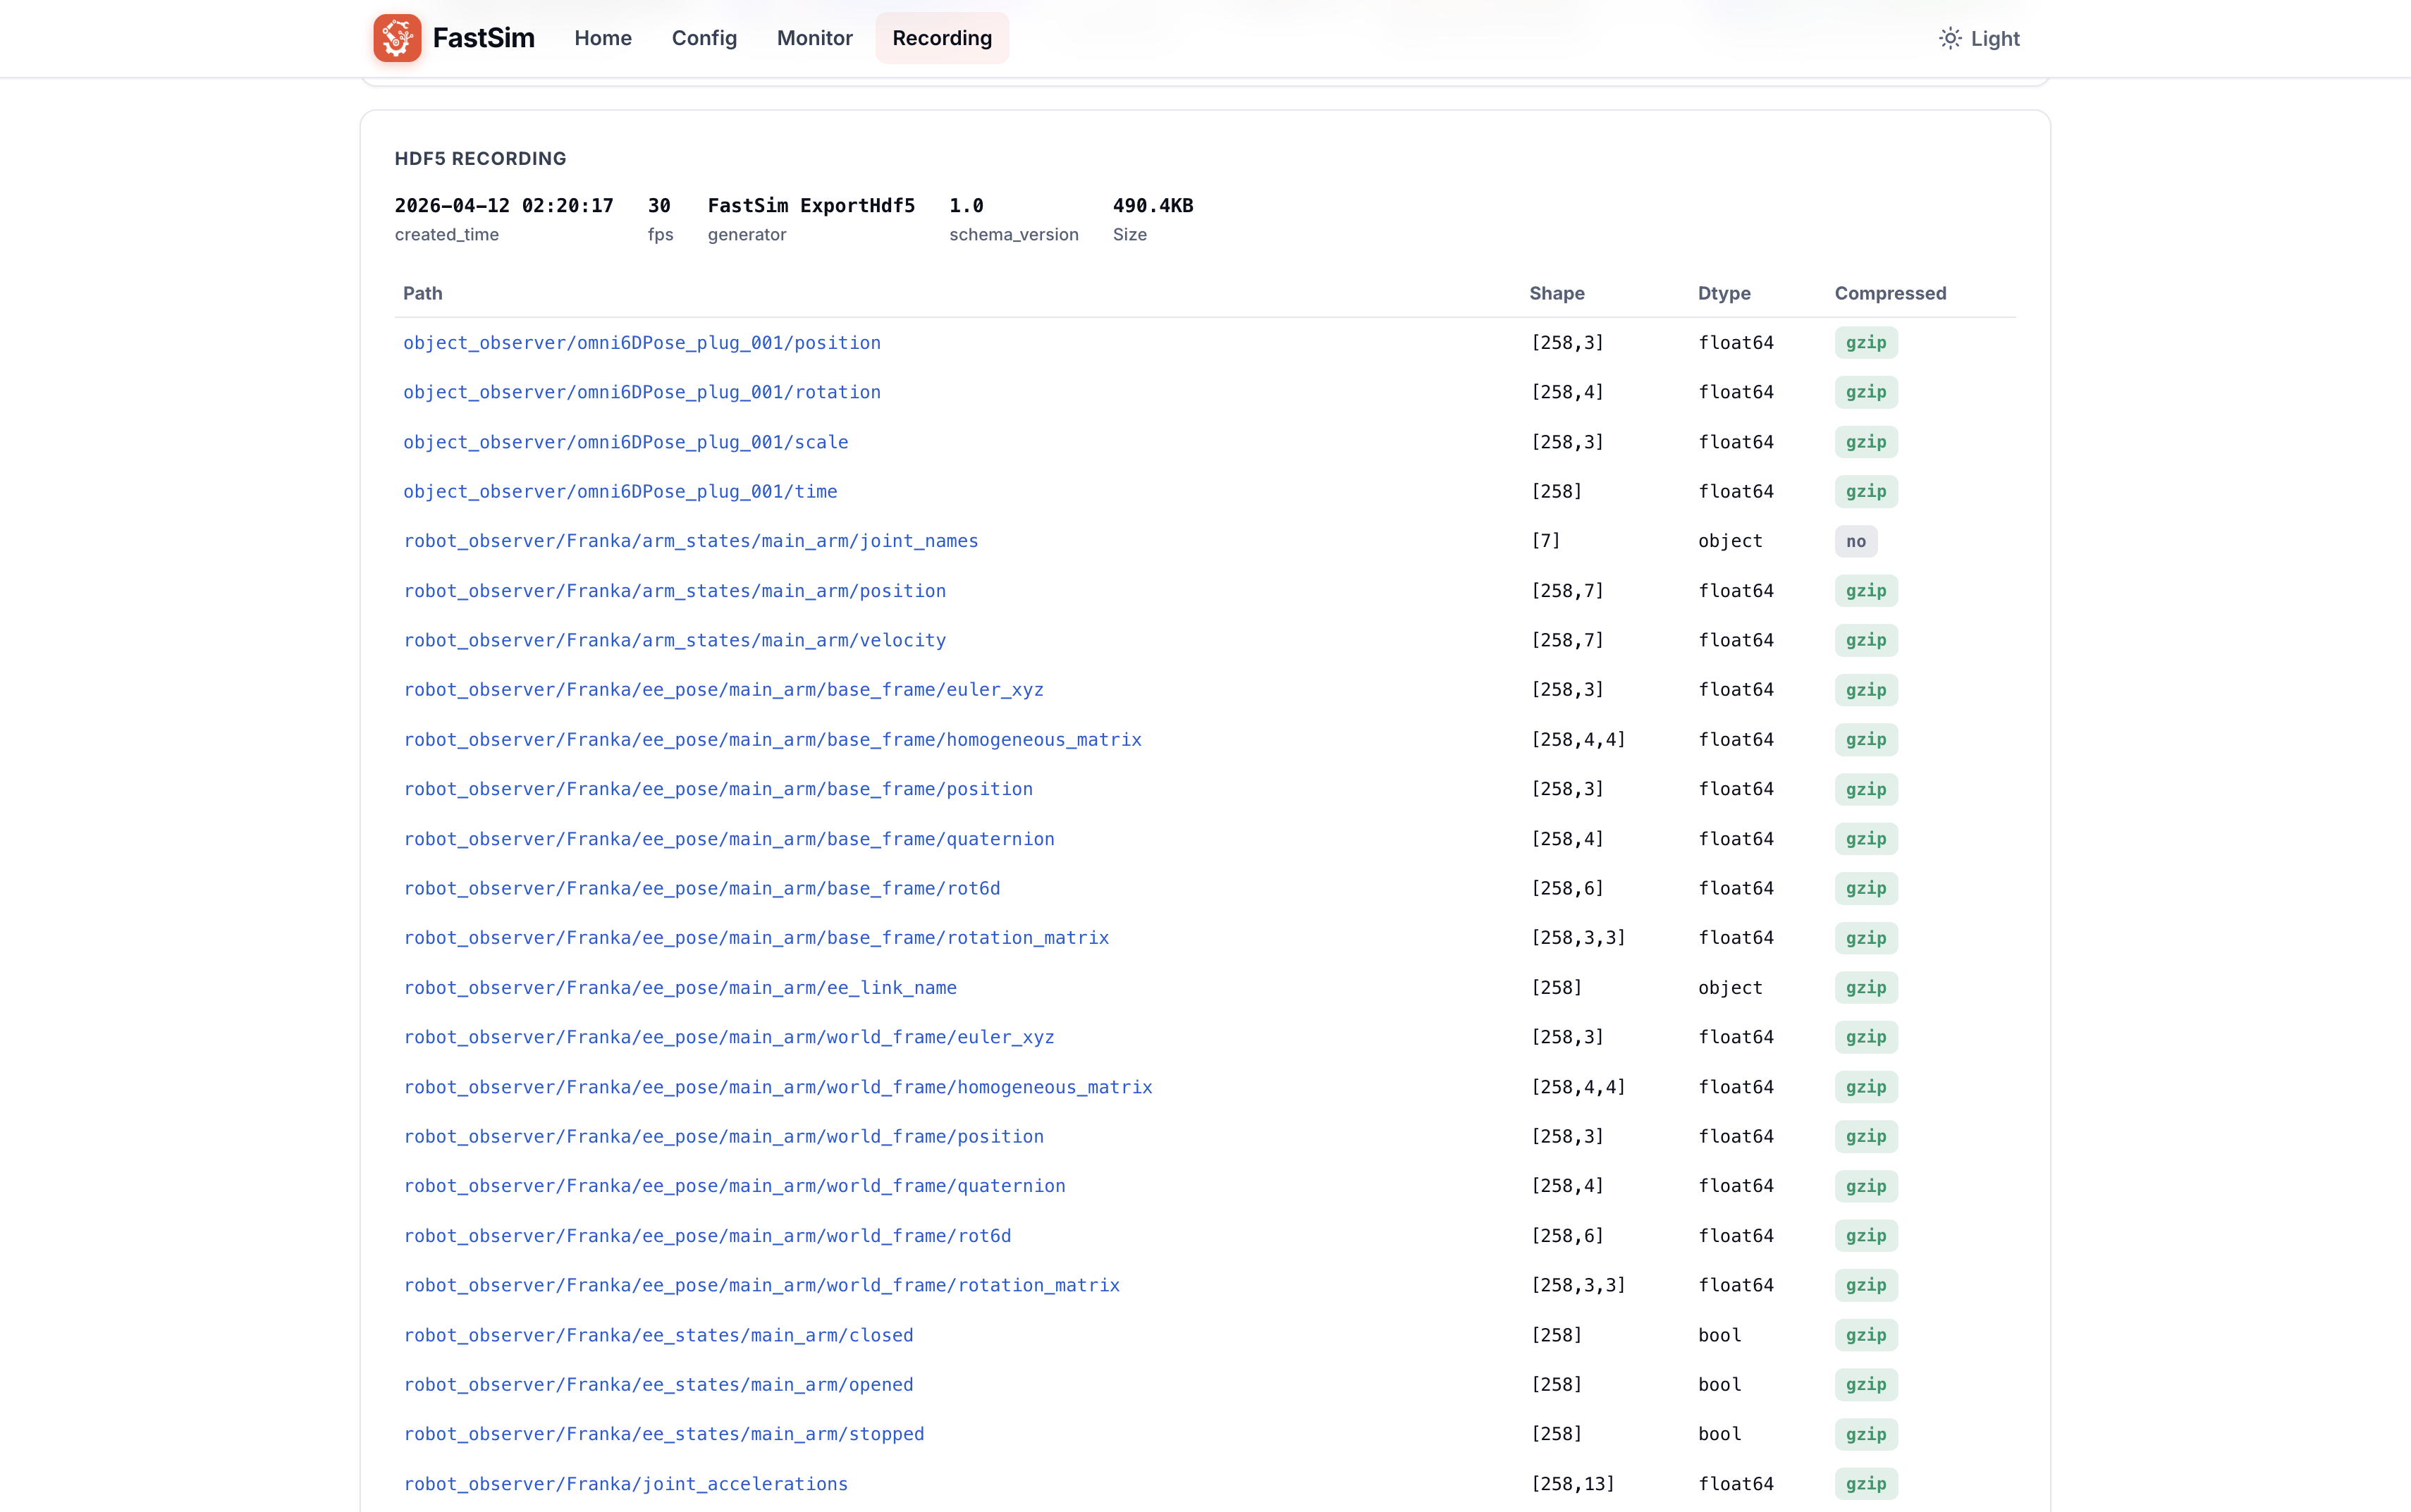 点击放大
点击放大 Displays all datasets in the HDF5 recording file as a table, with recording metadata (creation time, total frames, export version, schema version, file size). Each dataset shows:
- Path: Dataset path (e.g.,
robot_observer/Franka/joint_positions) - Shape: Data dimensions (e.g.,
[258, 7]= 258 frames, 7 joints) - Dtype: Data type (float64 / float32 / object / bool, etc.)
- Compressed: Whether gzip compression is used
Click any dataset row to expand and view its detailed content (array preview, statistics, etc.).
Trajectory Curve Analysis
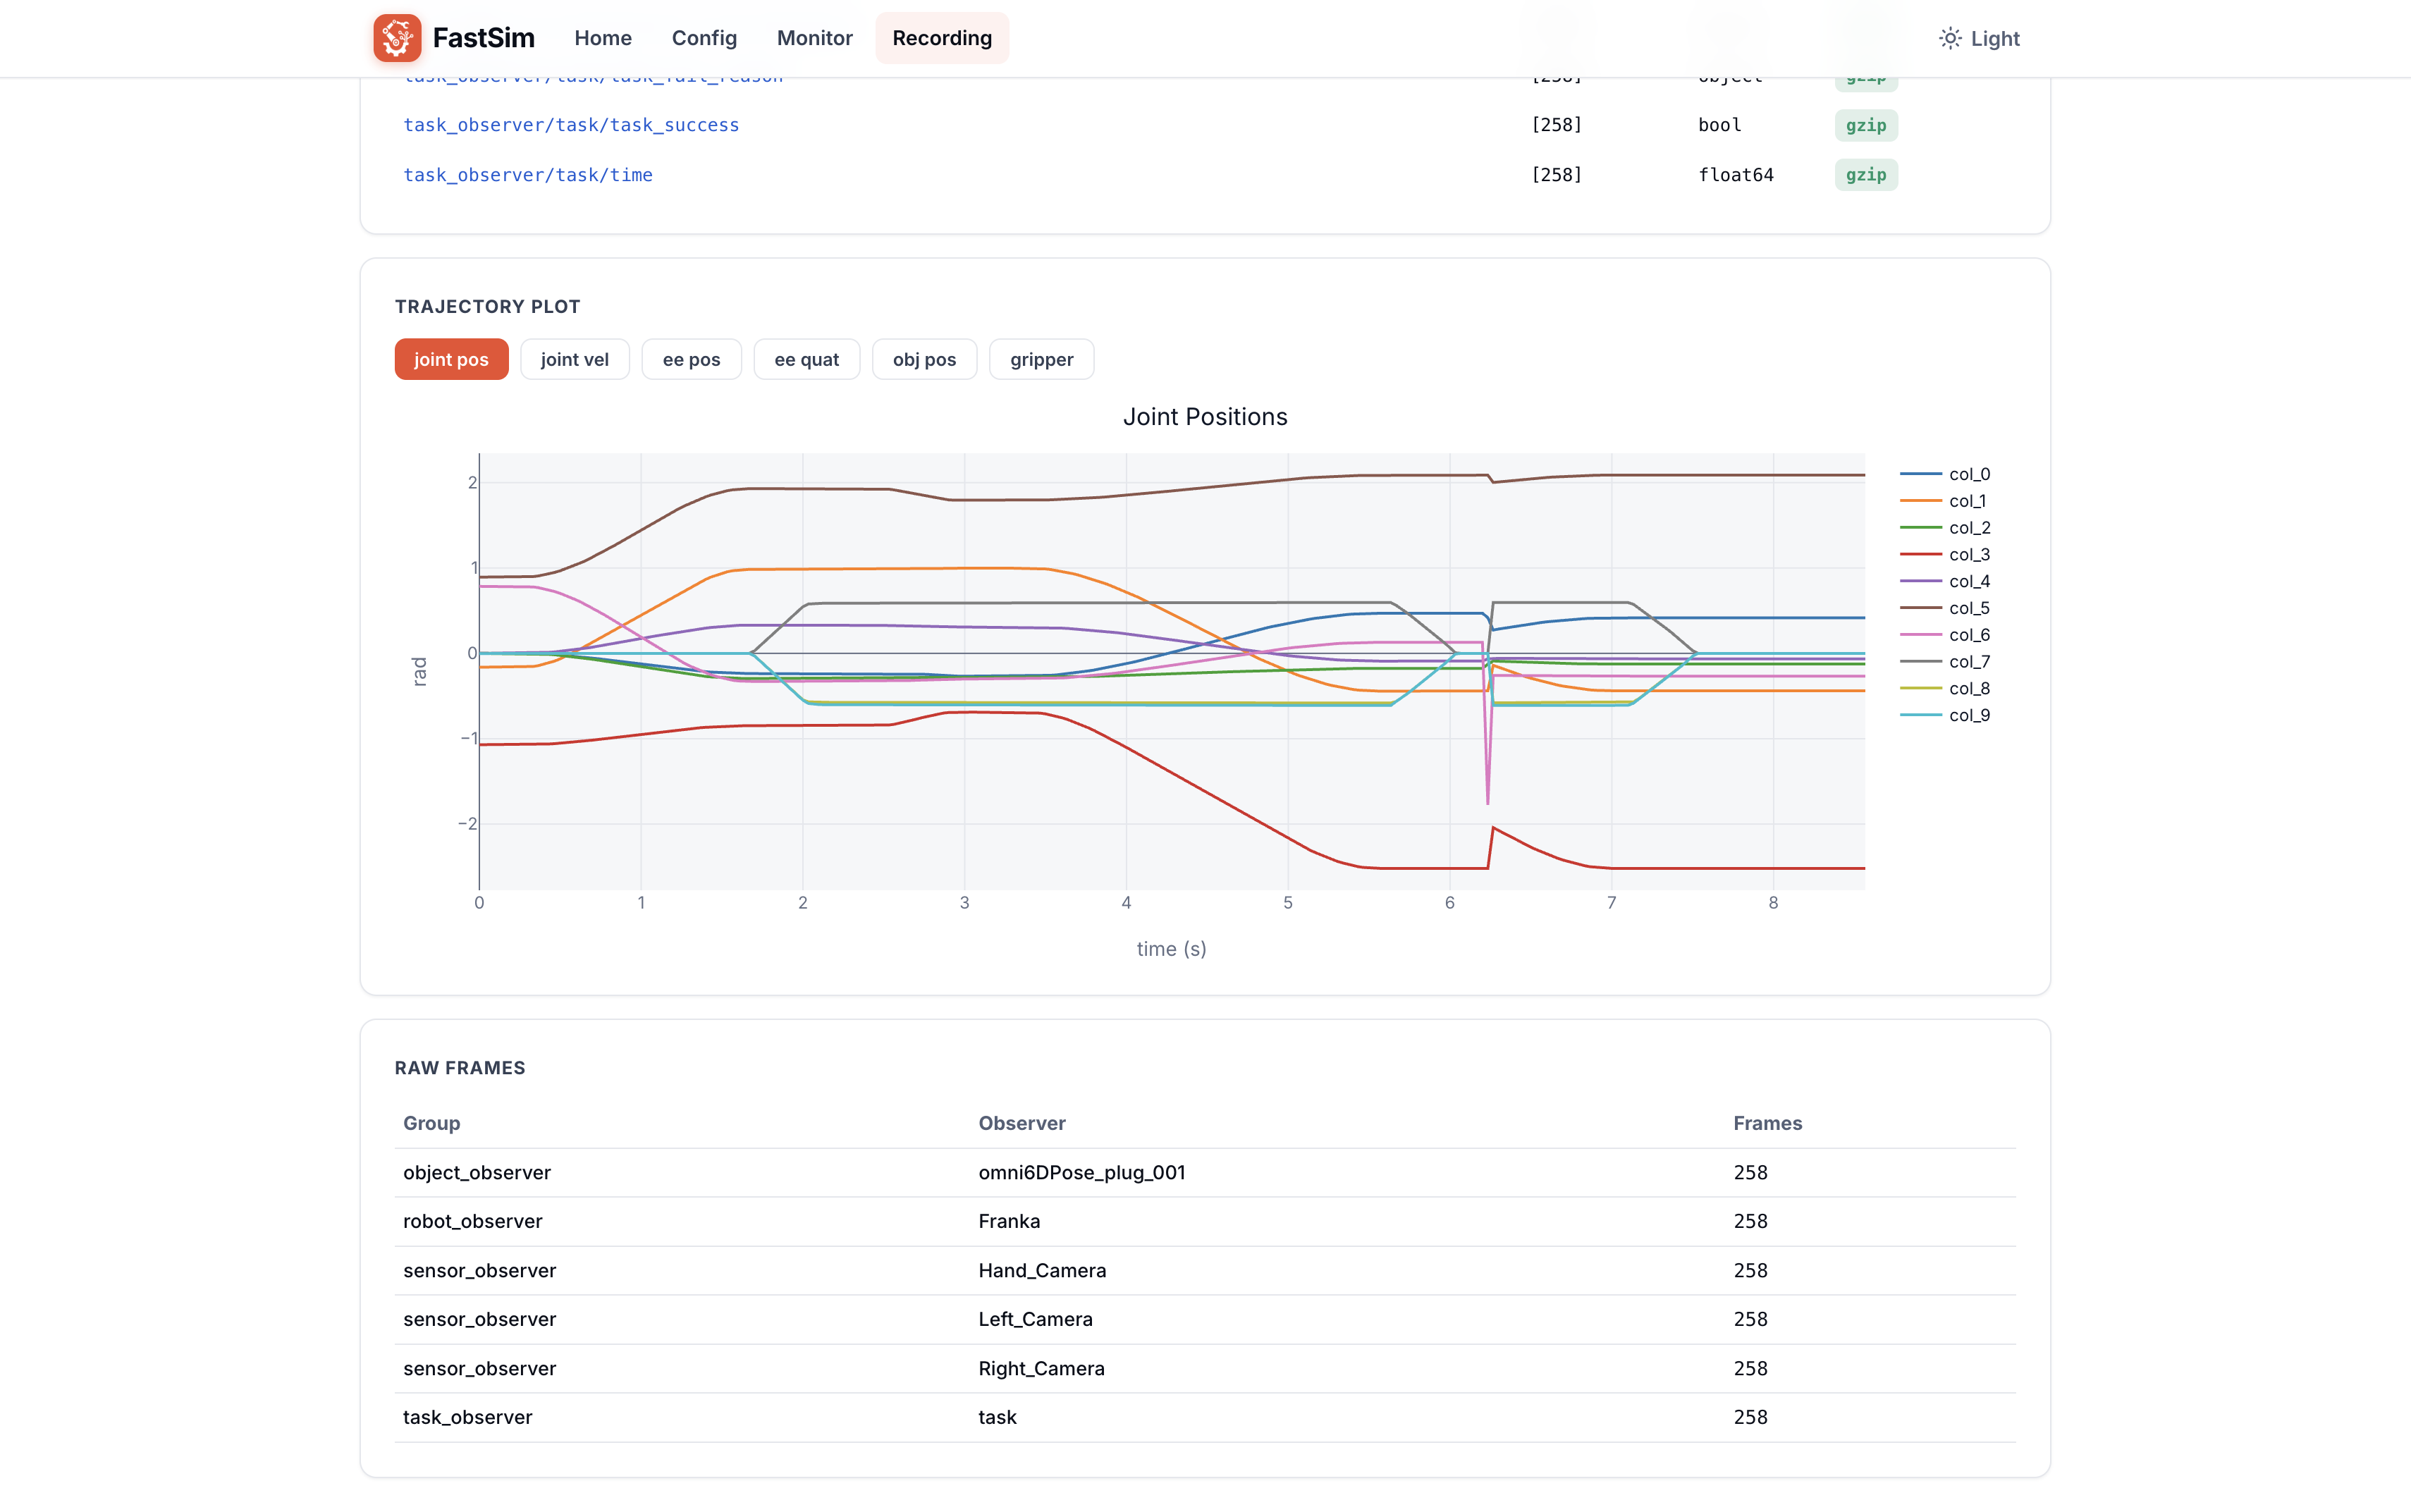 点击放大
点击放大 Interactive trajectory visualization for analyzing motion data from recordings. Preset mode tabs at the top let you quickly switch:
| Preset | Description |
|---|---|
joint_pos | Joint positions |
joint_vel | Joint velocities |
ee_pos | End-effector position |
ee_quat | End-effector quaternion |
obj_pos | Object position |
gripper | Gripper state |
The RAW FRAMES section below the charts shows per-observer frame counts (robot_observer / sensor_observer / object_observer / task_observer) for quick data completeness verification.
Home
The Web Console landing page / dashboard with quick navigation links.
Relationship with the Built-in REST API
FastSim has two HTTP services:
| Service | Port | Launch | Purpose |
|---|---|---|---|
| Web Console | 8080 | joysim_web | Browser UI (config/monitor/recording) |
| Built-in REST API | 5000 | Enable server extension in config | Programmatic access (curl / Python) |
The Web Console proxies requests to the simulation's port 5000 via /api/sim-proxy/*, so all simulation REST APIs are accessible from the Monitor page's API panel.
For programmatic REST API only (no browser UI), enable the server extension:
extension:
  extension_cfg_dict:
    my_server:
      stereotype: server
      enable: true
      port: 5000
See Extension Configuration — server and Server REST API Reference.
Web Console API Reference
The Web Console itself exposes REST APIs for automation and integration:
Simulation Management
| Method | Path | Description |
|---|---|---|
| POST | /api/simulation/start | Start simulation ({config_path}) |
| POST | /api/simulation/stop | Stop simulation |
| GET | /api/simulation/status | Get status (running / step / dt / fps / elapsed) |
| GET | /api/simulation/state | Get all state namespace snapshot |
| GET | /api/simulation/logs?limit=200 | Get last N log entries |
Config Management
| Method | Path | Description |
|---|---|---|
| POST | /api/config/load | Load config file ({path}) |
| POST | /api/config/validate | Validate config (body: config dict) |
| POST | /api/config/save | Save config ({data, path, format}) |
| POST | /api/config/export | Export in all three formats |
| GET | /api/config/stereotypes | Get all stereotype field schemas |
Monitoring & Camera
| Method | Path | Description |
|---|---|---|
| GET | /api/monitor/state | Get full state snapshot |
| GET | /api/monitor/state/<ns> | Get specific namespace state |
| GET | /api/camera/frames | Get all camera frames (base64 JPEG) |
Recording Analysis
| Method | Path | Description |
|---|---|---|
| POST | /api/recording/inspect | Inspect recording directory/HDF5 ({path}) |
| GET | /api/recording/video?path=... | Stream video file |
| POST | /api/recording/trajectory | Extract trajectory data ({h5_path, preset}) |
| POST | /api/recording/dataset | Read HDF5 dataset ({h5_path, dataset_path}) |
Simulation API Proxy
| Method | Path | Description |
|---|---|---|
| POST | /api/sim-proxy/<endpoint> | Forward to simulation built-in REST API (port 5000) |